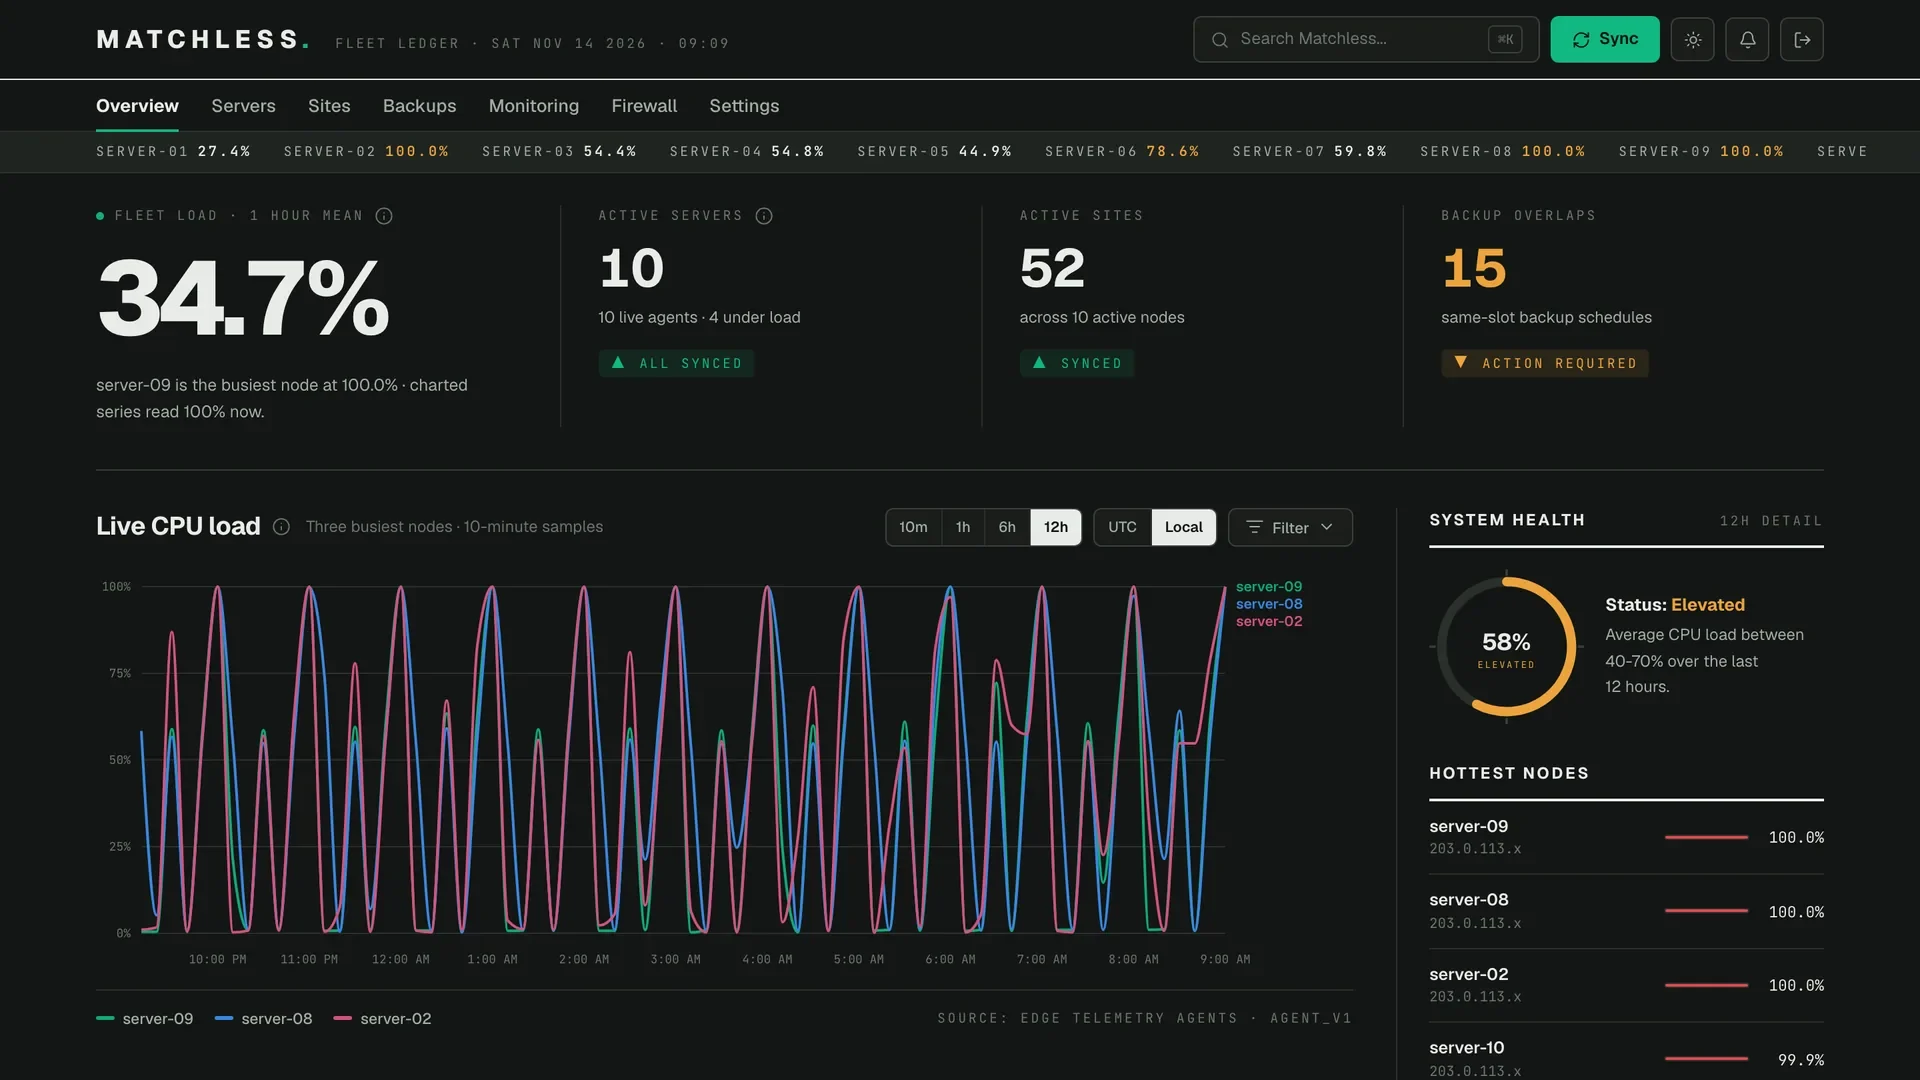
~/writinggridpane-opcache
Every site on a PHP version shares one OPcache. Most of mine were full.
On GridPane, every site on the same PHP version shares one code cache. When I first measured all of them, 13 of the 20 in use were full. How to check yours, what each number means, when to raise it, and why one PHP version for every site isn't always the right call.
Contents
PHP keeps a cache of compiled code in memory, called OPcache. Without it, every request reads and compiles every PHP file WordPress touches before it can run anything. On a GridPane server that cache isn't per site. It's per PHP version: every site running PHP 8.3 on a server shares one cache, and every site on 8.4 shares another.
Last weekend I added a panel for it to Matchless Fleet, the dashboard I run my GridPane servers from, and sent a small reader to every server. The first full read covered ten servers and 20 PHP versions in use. 13 of those 20 caches were full, and 12 of the 13 were still at the 128 MB they came with.
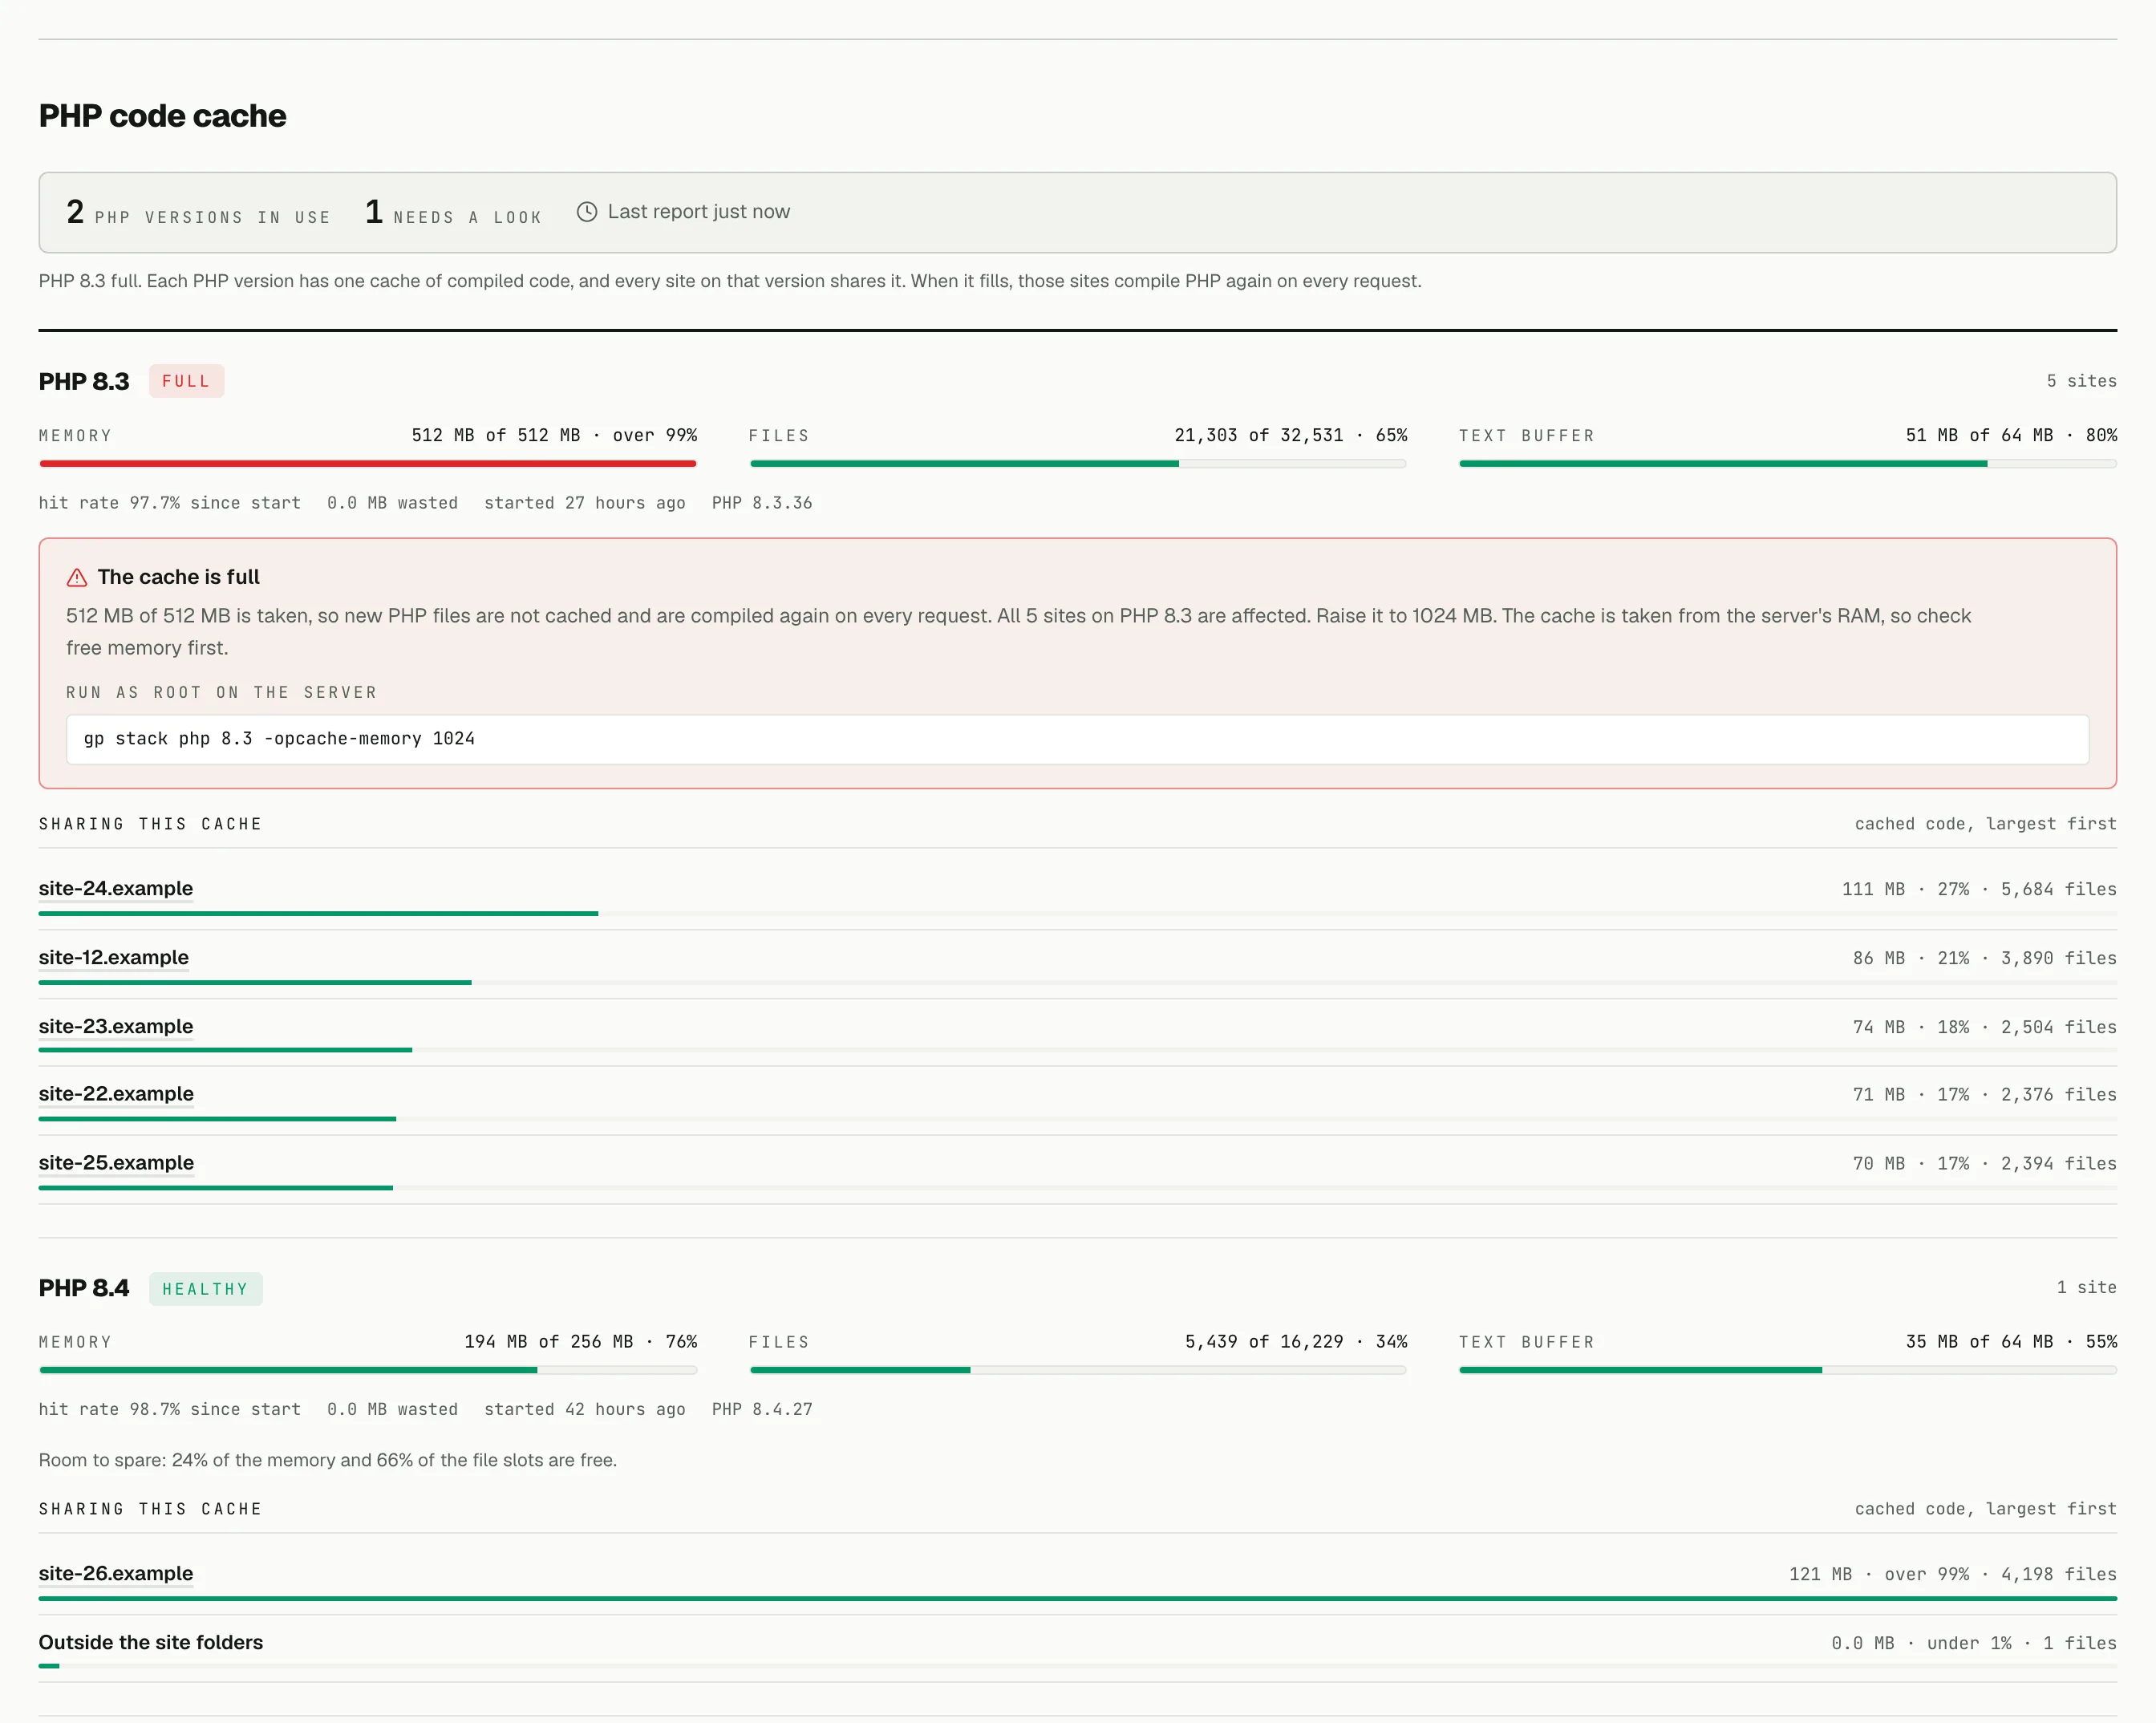
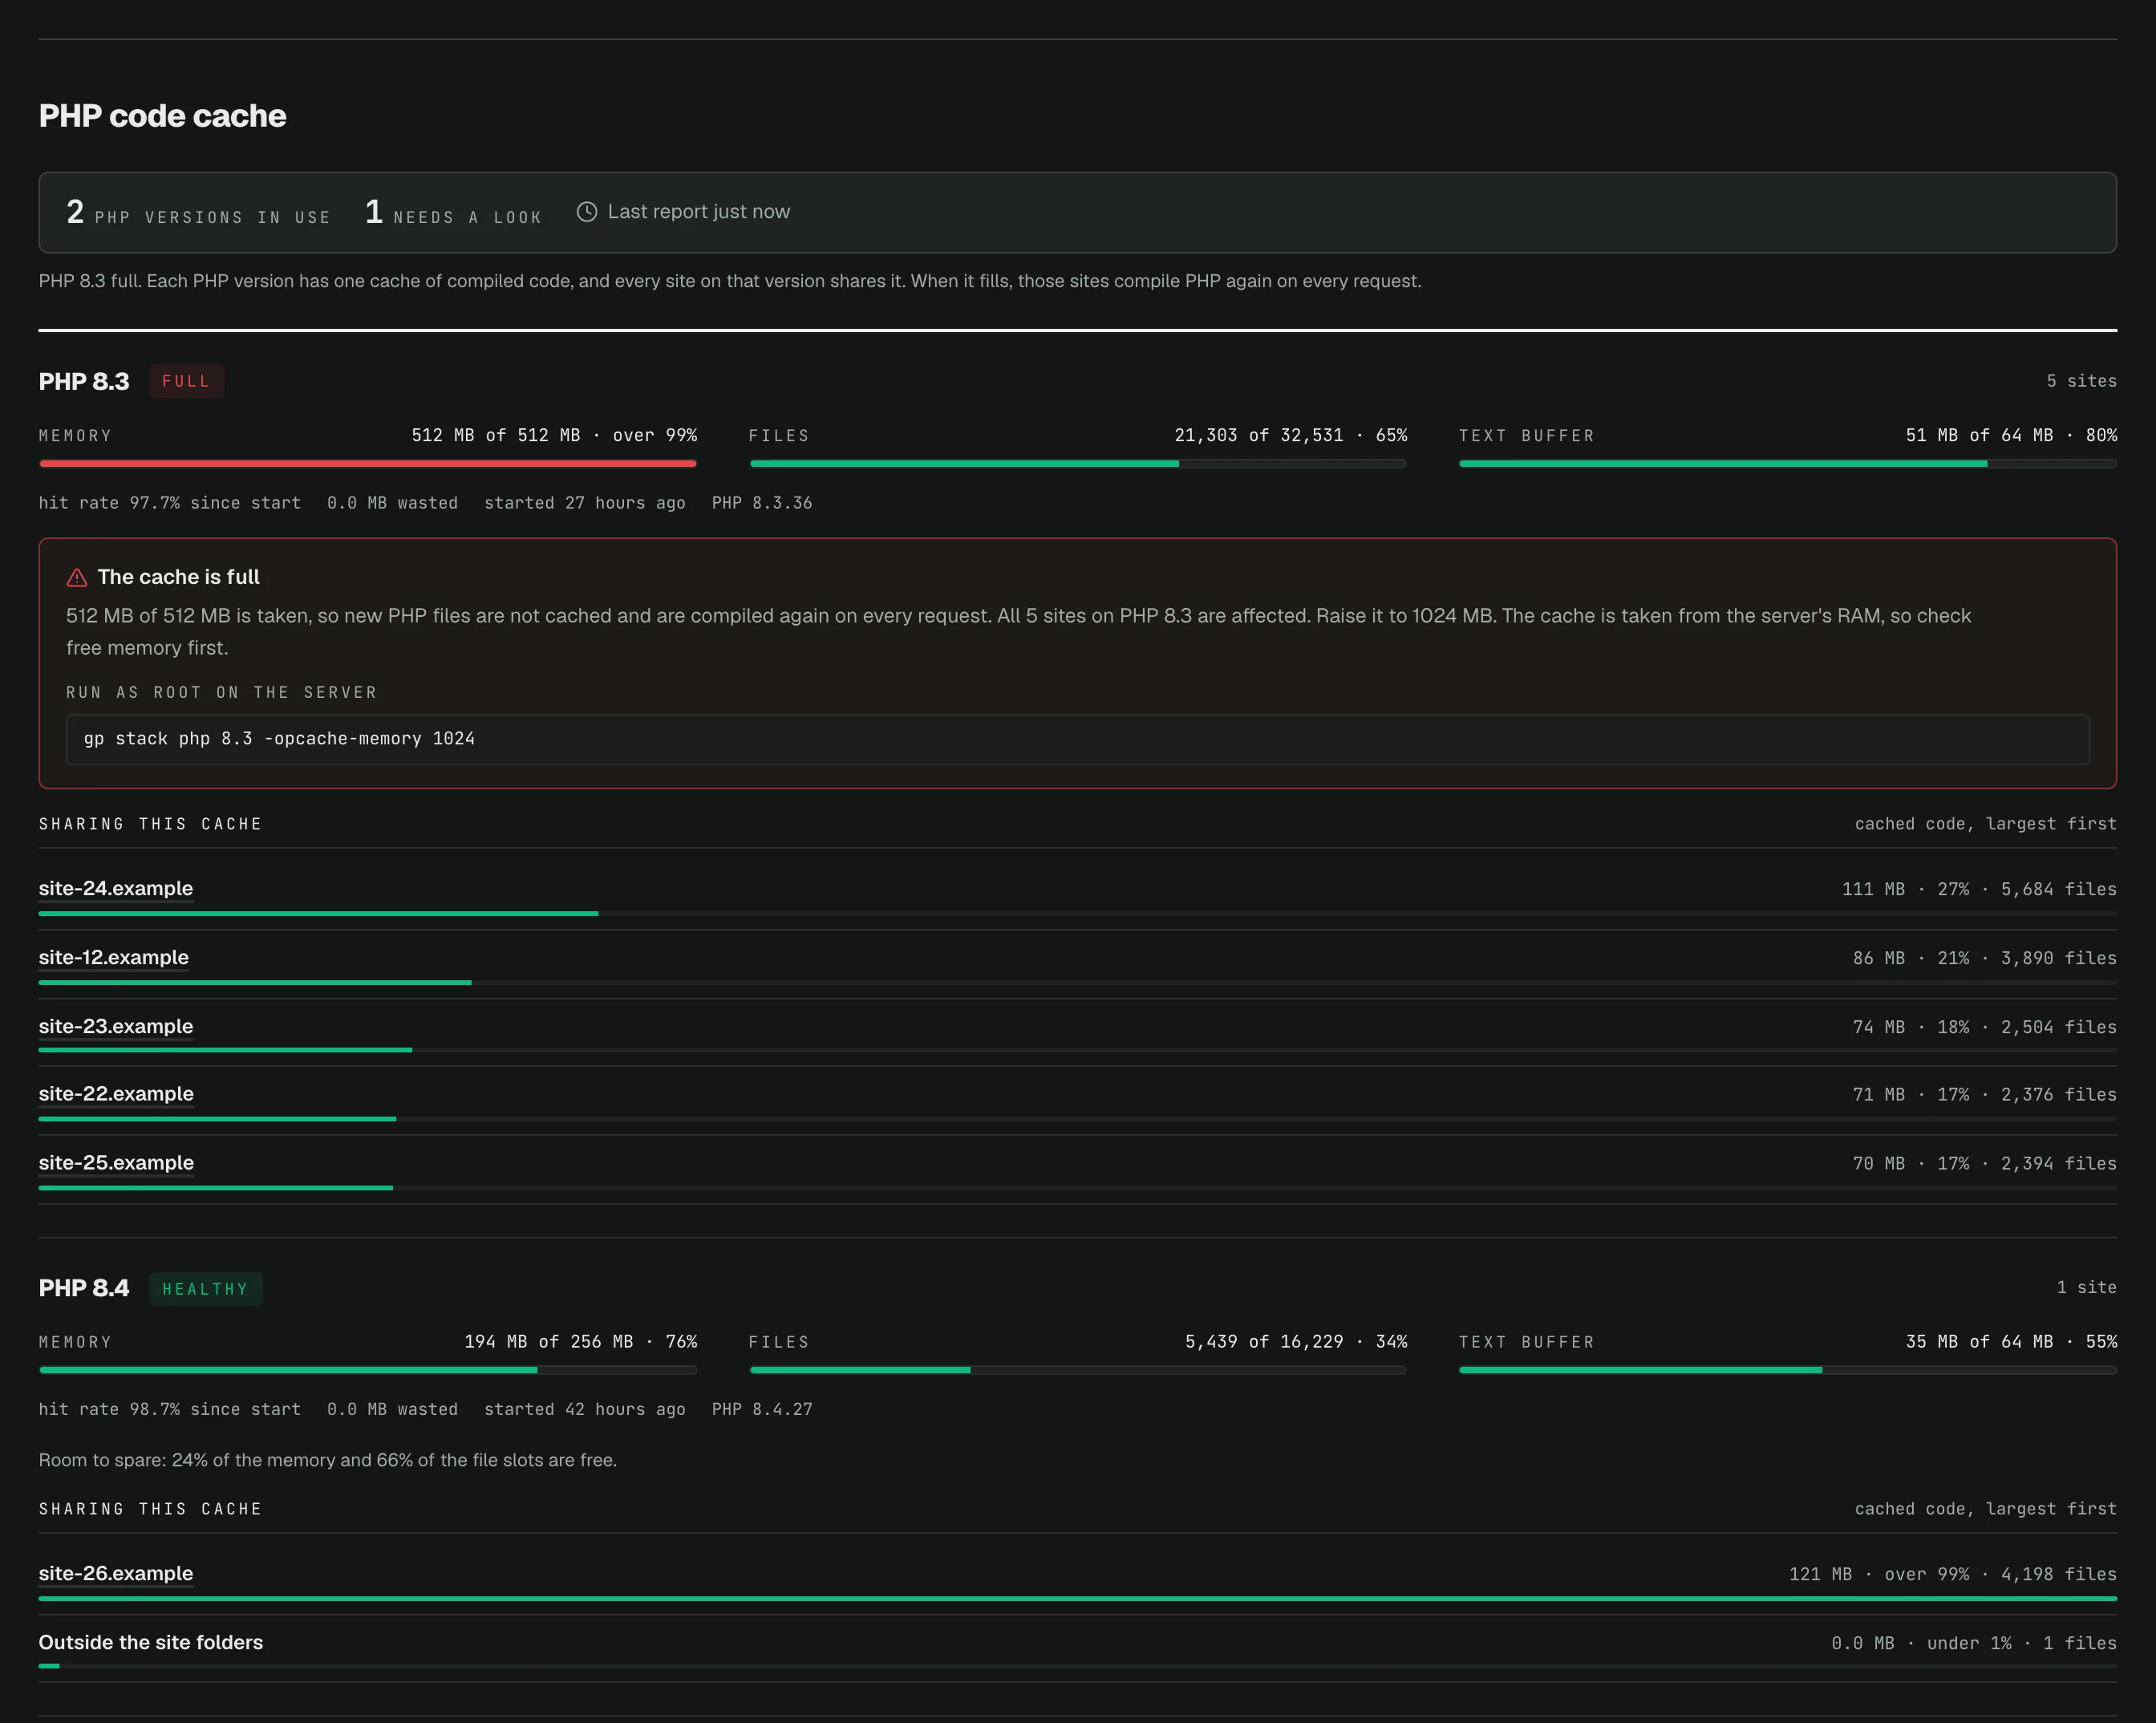
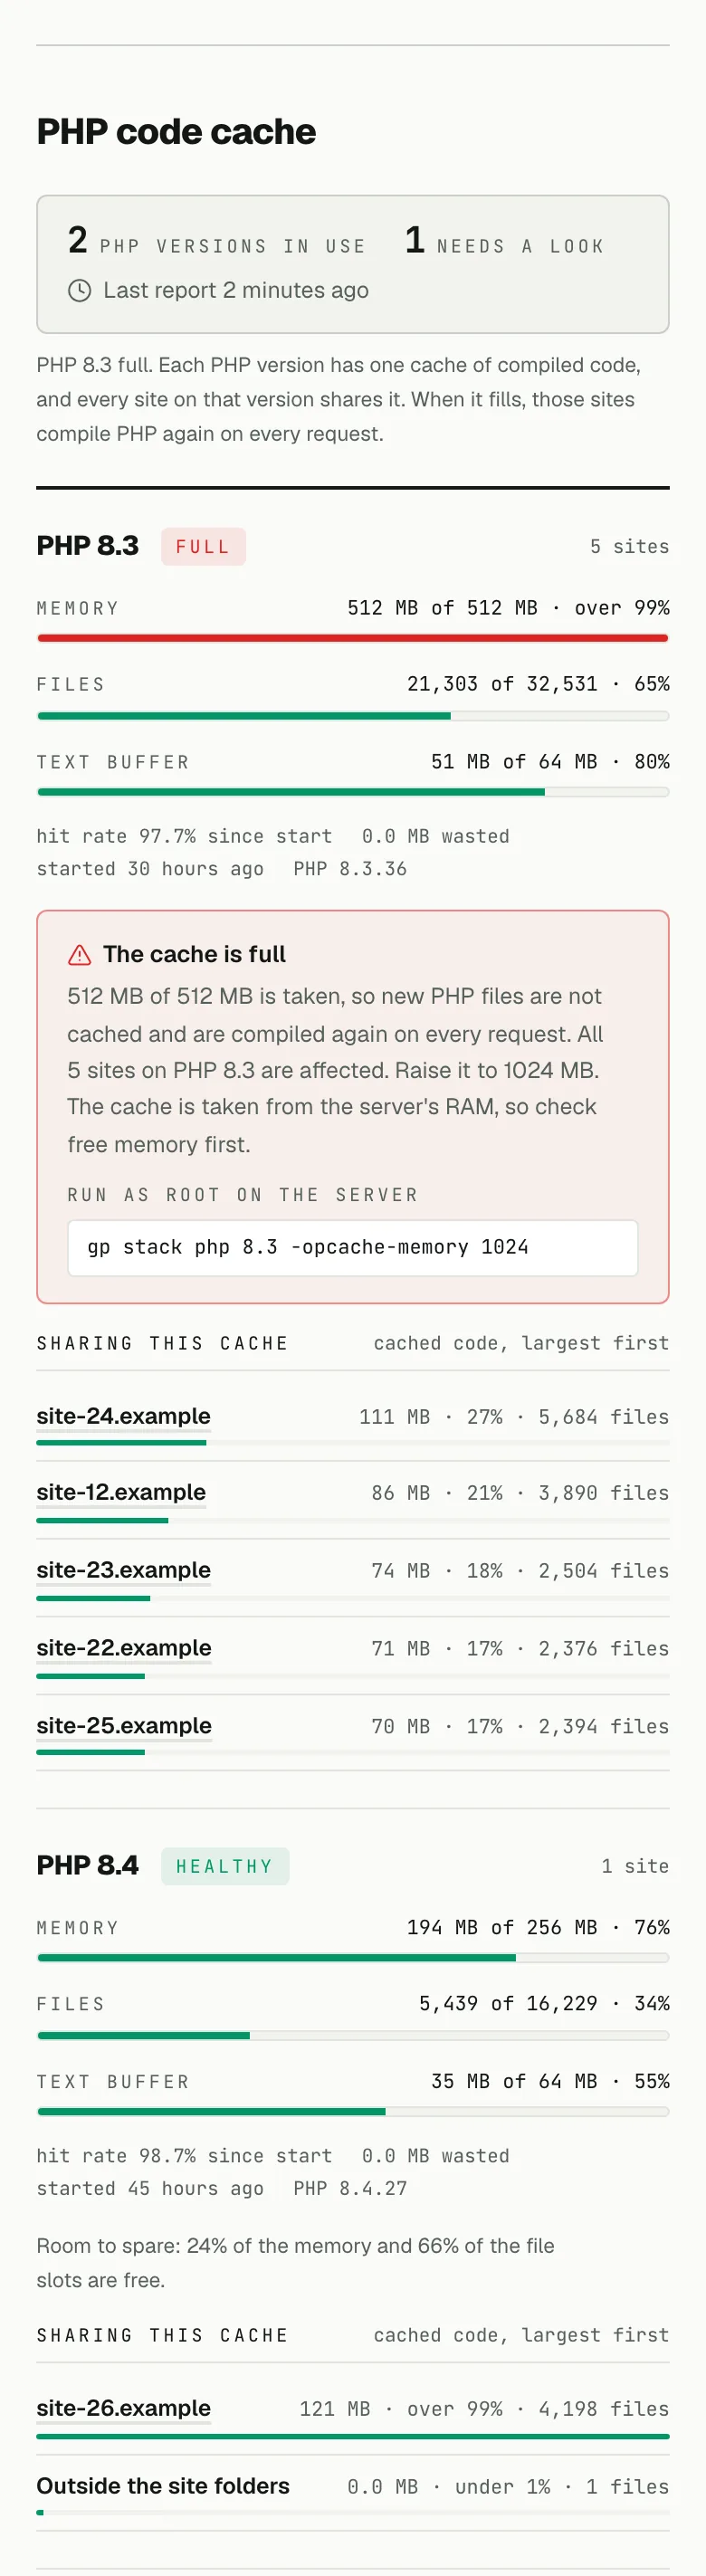
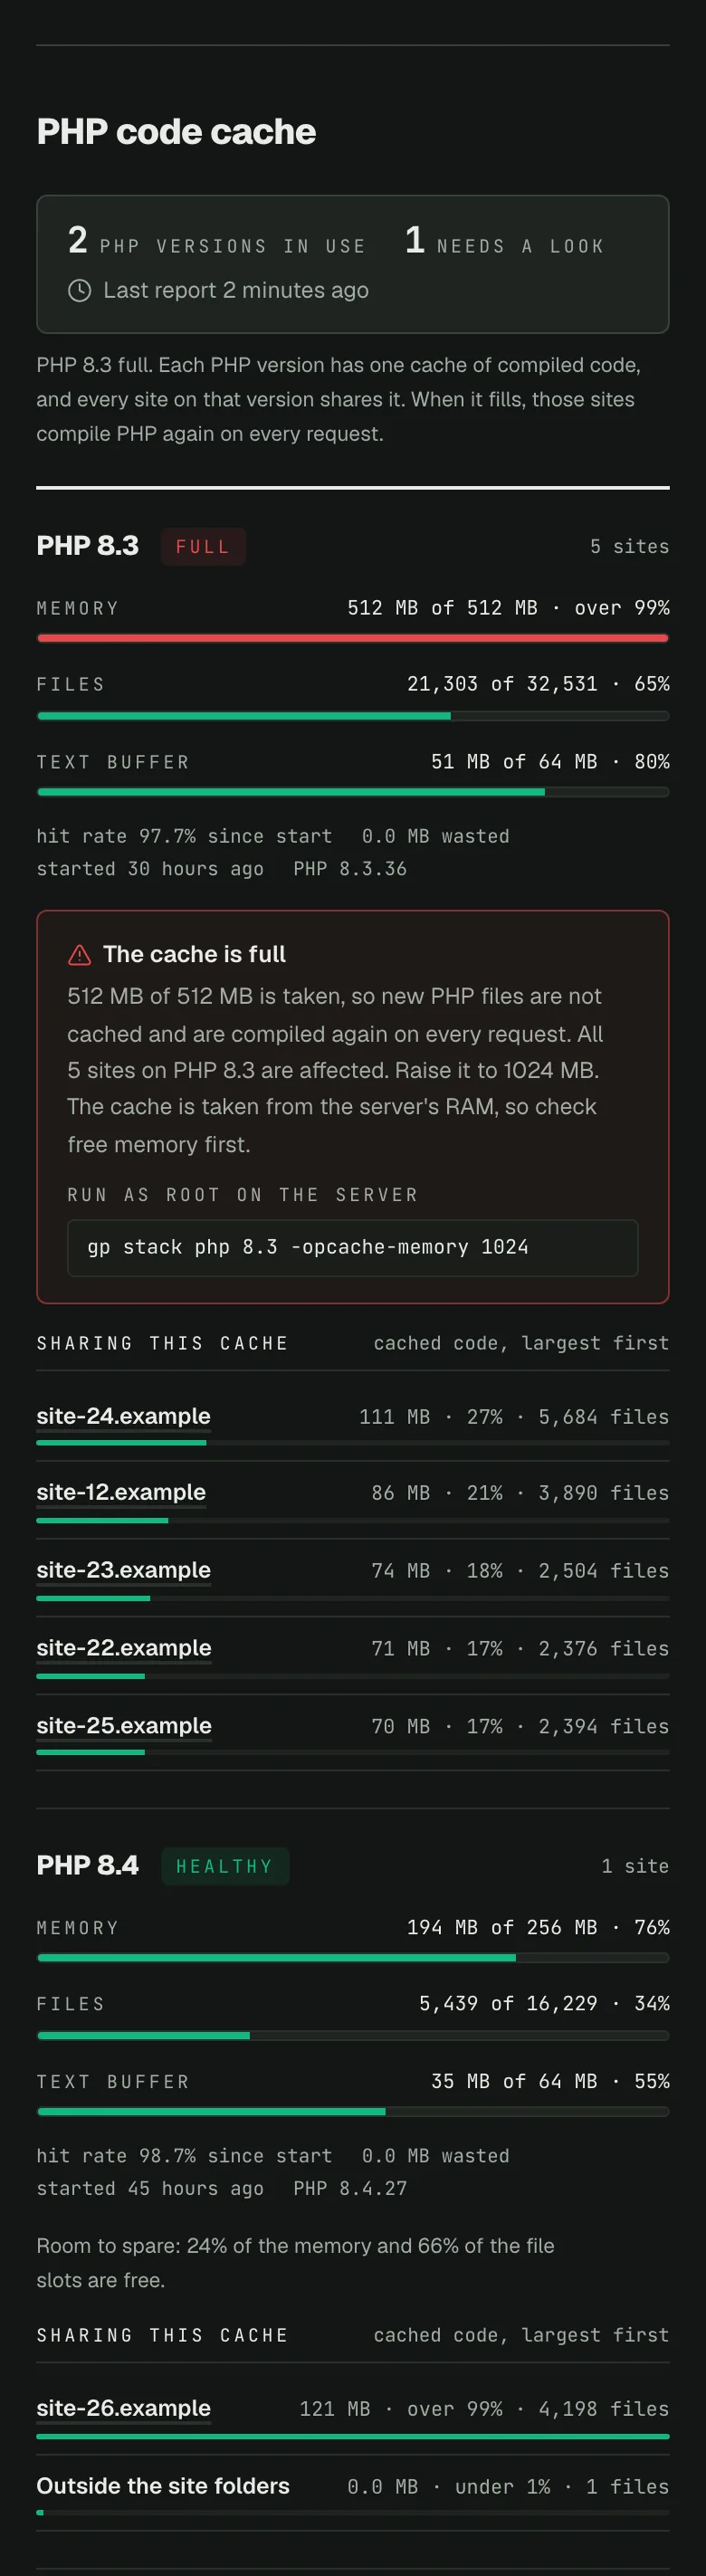
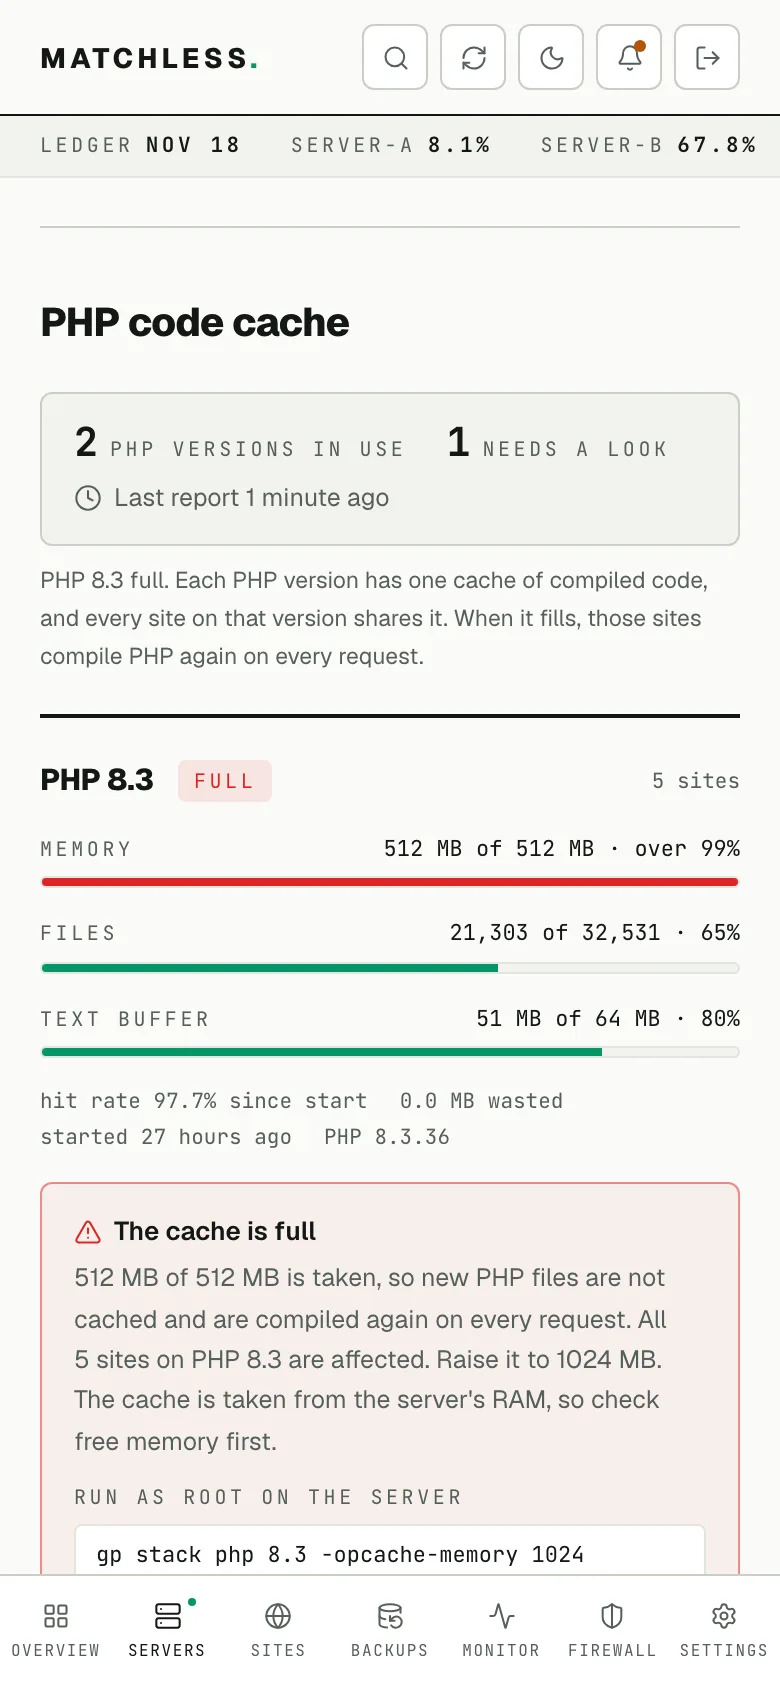
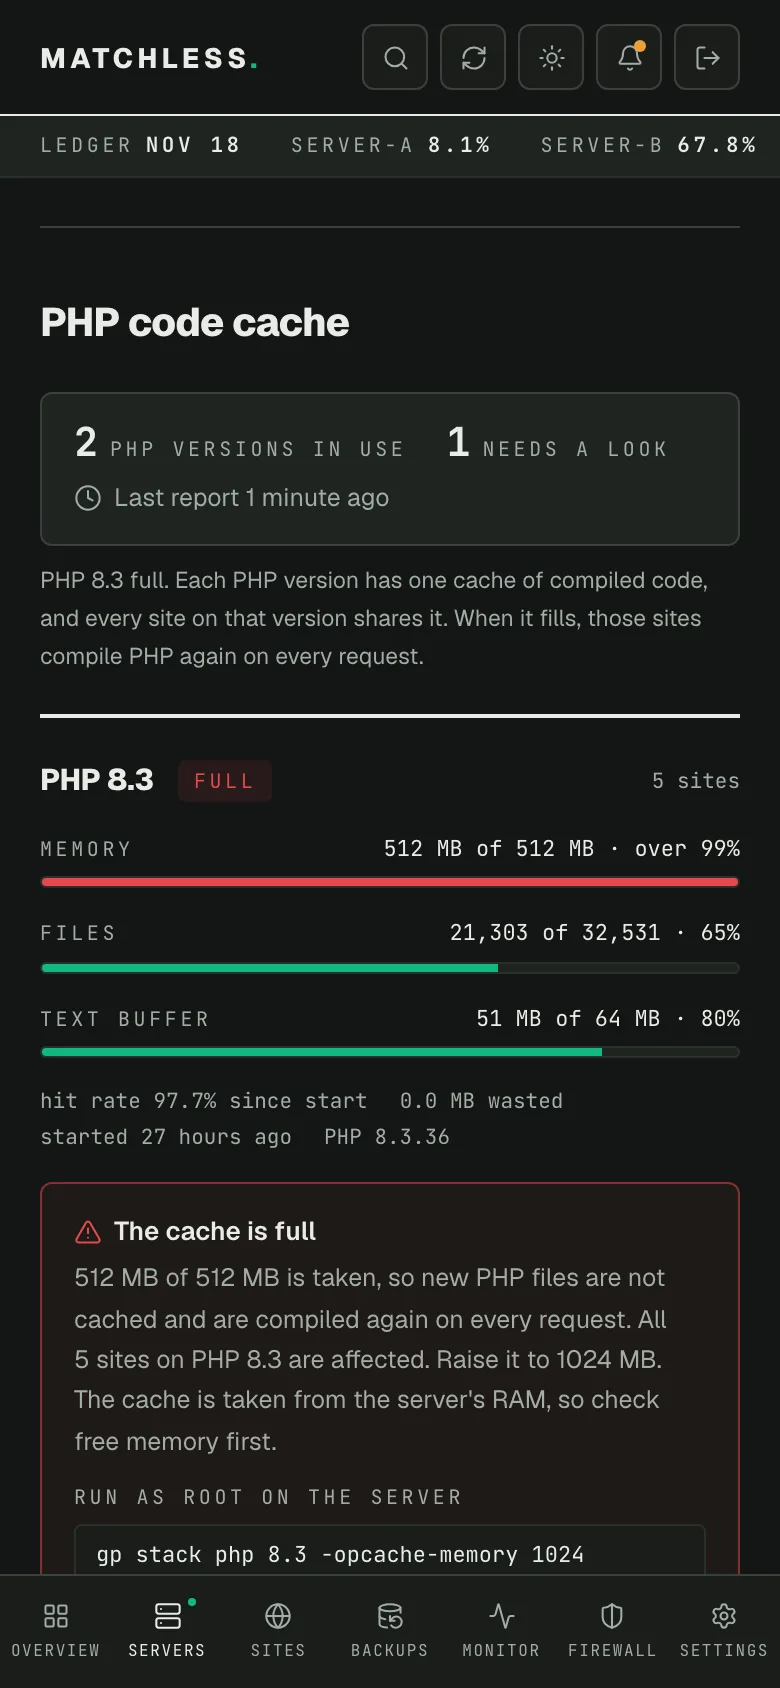
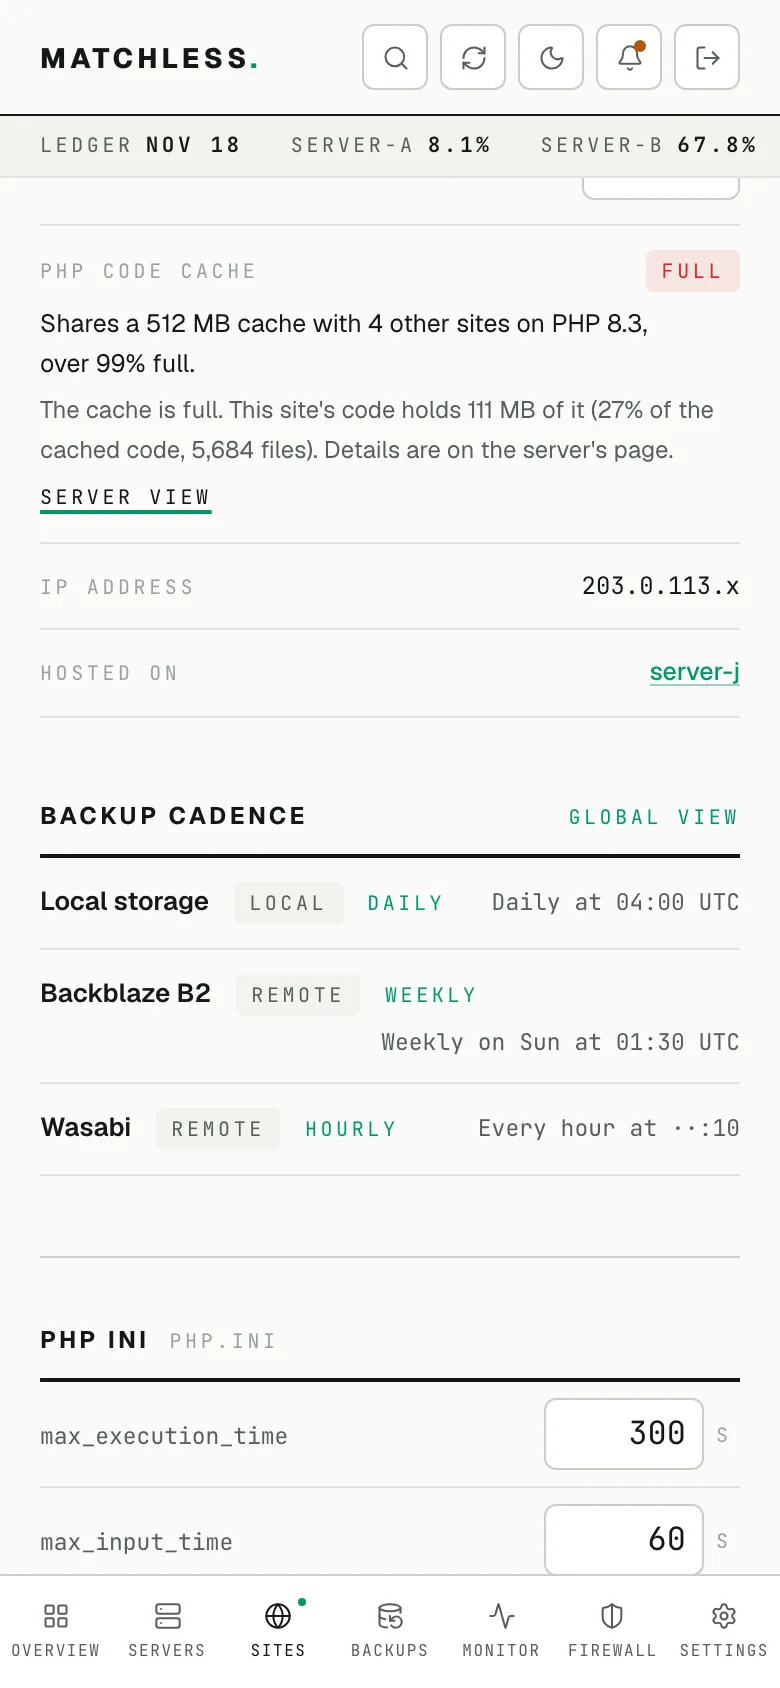
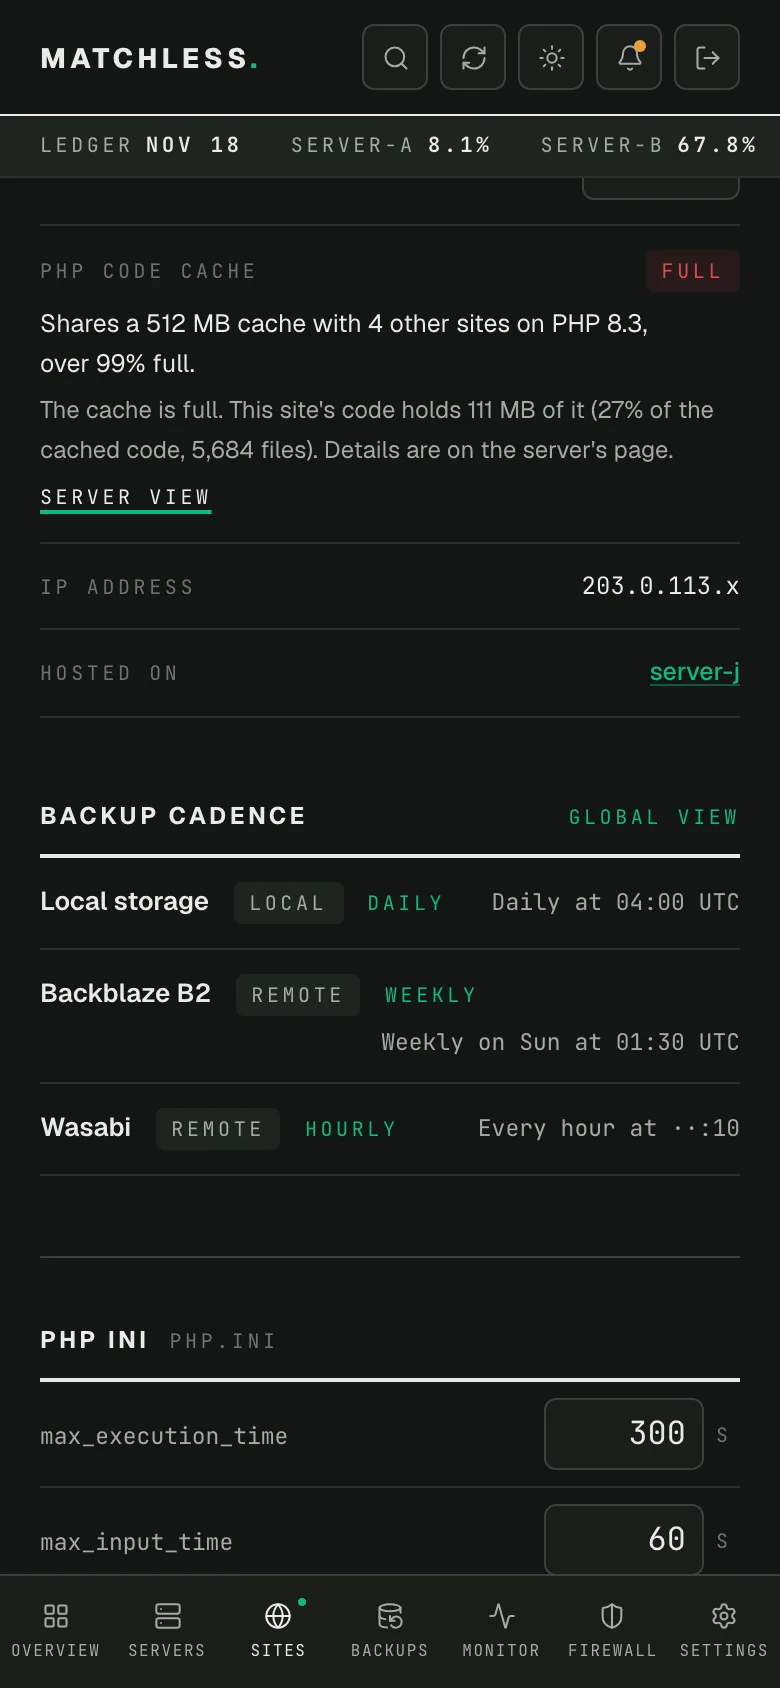
Drag the handle to compare light and dark mode. Every server, site and address in these screenshots has been replaced. This one is live from today: a 4 GB server whose PHP 8.3 cache is full at 512 MB, shared by five sites. It's the one I left full on purpose (more on that below), and its sites now run on a bigger server where that cache is 1024 MB.
This post covers what the cache is, why sites share it, a real case where a staging site took all of it, and the steps to check and size it on your own servers. At the end is a brief you can hand to an AI agent.
What is OPcache, and why does it fill up?
A PHP file has to be compiled before it runs. OPcache keeps the compiled version in shared memory, so the next request skips that step. A WooCommerce store with a page builder can have 5,000 PHP files in the cache, so a missing cache shows up on every page that isn't served from a page cache (a saved copy of the finished page).
The cache has a fixed size, set by opcache.memory_consumption. When it's full, PHP doesn't make room by dropping old files. What's in it stays (unless enough of it is wasted that PHP empties the whole cache and starts over), and new files are compiled into each request's own memory and thrown away afterward. Whatever loaded first after PHP's last restart wins, and everything after it pays on every request.
There are three limits, and any one of them can be the one that's hit:
- Memory:
opcache.memory_consumption, in MB. - File slots:
opcache.max_accelerated_files, a count of files. PHP rounds it up to a prime number: set 20000 and you get 32,531. - Text buffer:
opcache.interned_strings_buffer, in MB. It holds the strings PHP files share, such as function and class names. It comes out of the memory above rather than adding to it.
Why do sites on the same PHP version share one cache?
Because they share one PHP-FPM. PHP-FPM, short for FastCGI Process Manager, is the service that runs PHP for a website. The web server (nginx, on GridPane) hands it every request for a PHP page, and it keeps a set of PHP worker processes ready to answer them.
GridPane runs each installed PHP version as its own PHP-FPM service. Each one has a master process, which starts and supervises the workers, and a pool per site: that site's own group of workers, with its own settings. The master sets aside the cache's shared memory, memory that every worker can read, once, and every pool under it uses that same block. Two PHP maintainers said it plainly in PHP's bug tracker (opens in a new tab): "there is only one OPcache SHM for all FPM pools" (SHM is shared memory), because "the shared memory is allocated just once" by the master.
So the cache is set per PHP version, server-wide. GridPane's command-line tool, gp, works that way (its gp stack php commands change PHP one version at a time), and its knowledge base (opens in a new tab) says OPcache can only be set at the PHP version level. You won't find a per-site OPcache setting.
Two things follow from that:
- A staging copy is one of the neighbors. GridPane's staging site, a private copy of a site for trying changes before they go live, runs on the same server, usually on the same PHP version as the live site. Its code goes into the same cache.
- The command line can't see it. WP-CLI's
wp evaland PHP's ownphp -rrun PHP from the command line, outside PHP-FPM, with a cache of their own (GridPane setsopcache.enable_cli=0, which switches it off there). So they report an empty or switched-off cache no matter how full the real one is. The only way to read the real cache is a request through one of that version's PHP-FPM sockets: the connection points nginx uses to hand requests to PHP-FPM, one per site.
What happens when staging fills it?
A client's WooCommerce store had its own server: 4 CPUs, 7.75 GB of RAM, the live store and its GridPane staging copy, both on PHP 8.4. We were rebuilding the store's theme on the staging copy that day.
I found the problem while tracing a PHP memory alert, not a speed complaint. The cache was 128 MB, completely full, with 3,568 files in it. Every one of them was from staging. None was from the live store. The hit rate, the share of PHP file loads served from the cache, was 43%.
The giveaway was memory per request. Right after WordPress loaded, a live request used 221 MB, because code the cache can't hold gets compiled into the request's own memory. PHP-FPM held 2.7 GB in total, and the server had 1 GB in swap: memory pushed out to disk, which is far slower.
I raised the cache to 512 MB, the file limit to 20,000 and the text buffer to 64 MB. Ninety seconds later the cache held 10,161 files: 5,153 live and 5,008 staging, 347 MB together. The hit rate was 94% and then 97% five minutes later. A live request used 36 MB, and the server's available memory went from 2.2 GB to 4.4 GB. A bigger cache freed memory, because it stopped every request from carrying its own compiled copy.
Two more servers checked that month told the same story. The Heavy Artillery (opens in a new tab) shop runs on a smaller server, 2 CPUs and 3.9 GB, where three PHP 8.4 sites shared a full 128 MB cache with a 26% hit rate. Raising it to 256 MB, with 20,000 file slots, cut the shop's uncached server time (how long the server takes to build a page that isn't in the page cache) by 41 to 50 percent:
Page, uncached | 128 MB, full | 256 MB |
|---|---|---|
Home | 1,674 ms | 994 ms |
Shop listing | 1,644 ms | 960 ms |
Product | 1,707 ms | 1,005 ms |
Checkout | 1,316 ms | 662 ms |
And a third store's cache, on its own 8 GB server, was full within a minute of PHP reloading for a staging build.
How do I check it on my own GridPane server?
These steps are for one GridPane server. Run them on the server as root. Nothing in steps 1 to 4 changes a setting or reloads PHP.
Before you start
- You need root over SSH. PHP's sockets on GridPane belong to
www-datawith mode 0640 (only their owner and group can use them), so a normal user can't talk to them. - Python 3 is already on GridPane's Ubuntu servers. The script below needs nothing else.
1. See which PHP versions your sites use. Each site has its own socket, named after the PHP version without the dot:
ls /var/run/php/php84-fpm-example.com.sock is example.com on PHP 8.4. php8.4-fpm.sock and php8.4-fpm-debug.sock are GridPane's own stock pools. GridPane keeps every installed version running, even ones no site uses, so expect a few versions with no site sockets at all.
2. Read the settings as written.
grep -n '^opcache' /etc/php/8.4/fpm/php.iniOn every server I read, GridPane's values were 128 MB of memory, 10,000 files, an 8 MB text buffer and revalidate_freq 60 (PHP checks a cached file for changes at most once a minute). (GridPane's knowledge base says the memory default is 64 MB, so read your own rather than trusting either.) Files in /etc/php/8.4/fpm/conf.d/ are read after php.ini and win if they set the same line.
3. Read the live numbers. The settings file says how big the cache may be, not how full it is. For that you have to ask PHP-FPM itself. I wrote a short script for it, from the same reader my dashboard's agent runs on every server: opcache-check.py. Read it before you run it; it's about 370 lines, Python's standard library only.
curl -fsSO https://jonphillips.dev/posts/gridpane-opcache/opcache-check.py
less opcache-check.py
python3 opcache-check.py
What it does, per PHP version: it reads the opcache lines in php.ini and conf.d, finds each site's socket in the pool files, and writes one tiny read-only PHP file to /var/lib/opcache-check/probe.php. That folder is outside every web root, so the file can't be reached from the web. Then it asks one site's socket to run that file, speaking FastCGI, the same protocol nginx uses, and prints what PHP says. It changes no setting and reloads nothing. python3 opcache-check.py --clean removes the file when you're done.
Here's its output from a test PHP-FPM on my Mac, laid out like a GridPane server, with a deliberately tiny 16 MB cache and the staging site loaded first. It's the store above in miniature:
PHP 8.5: 3 sites with a pool
  settings file: memory 16 MB, files 10000, text buffer 8 MB, revalidate_freq 60
  running PHP 8.5.3, cache started 0.0 hours ago
  memory           16 of 16 MB taken (100%), 0.0 MB of it wasted
  file slots      710 of 16,229 (4%)
  text buffer     3.5 of 8 MB (43%)
  hit rate     26.3% since the cache started (5,407 file loads)
  cached code by site folder, largest first:
    staging.live.example                         7.3 MB  100%     710 files  <- staging
    live.example                               nothing cached
    quiet.example                              nothing cached
  -> FULL. Only 1 of 3 sites has code in the cache; the rest did not fit.
     Raise it to about 128 MB (a guess scaled from the sites that fit), then check again a day later.
     gp stack php 8.5 -opcache-memory 128    (the cache comes out of RAM: check free -m first)
  -> STAGING holds 100% of this cache, in the same cache the live sites use.
     Move staging to a PHP version of its own, or delete it when the work is done.
On one of my real servers, the same script found a staging copy holding 28% of the PHP 8.4 cache, matching the dashboard to the megabyte.
4. Read the result. These are the lines that matter, and the levels I use:
- Memory taken includes wasted space, because space held by old copies of changed files can't take new code either. It also includes the text buffer, which lives inside it. 85% is nearly full. 95%, or PHP reporting it full, means full.
- Cached code by site folder is the line most checks skip. A cache can be full and healthy for one site while another site on the same version has nothing in it. Look for a live site with "nothing cached" next to a staging site with hundreds of MB.
- File slots: 75% is close, 90% is the limit. Past it, files aren't cached even with memory free.
- Text buffer: 85% is nearly full. When it fills, each PHP worker keeps its own copies of those strings, which costs memory.
- Hit rate since the cache started is an average over every request since PHP last restarted, so a cache that filled an hour ago can hide behind a good number.
--sample 60reads the cache twice, a minute apart, and gives the hit rate for that minute, if at least 500 files were loaded in it. Behind a page cache, that can take a while: one WordPress request loads a few thousand files, so a minute with no uncached request reads as too few to judge, which is normal. Above 99% is healthy. Under 90% needs a look, but only on a server busy enough for the number to mean something: I don't judge a lifetime rate until it covers 10,000 file loads. - Right after a restart, every cache reads low while it fills. Give it 30 minutes before judging the hit rate. A full cache is full at any age.
5. Check that the server has the memory. Each PHP version's cache is its own block of RAM. It fills as code is cached rather than all at once, so free -m may barely move right after a raise; plan for the full size anyway. Raising three versions adds three times. free -m shows the server's memory in MB:
free -mLook at the available column. My rule while raising them was to stop if available memory was under about 1,500 MB on a 4 GB server, 2,200 MB on an 8 or 16 GB server, and 4,000 MB on a 32 GB server, and to leave room for the database and PHP's workers. For a rough size, the WordPress sites I measured each held about 80 to 110 MB of compiled code, and the WooCommerce store above about 5,000 files per copy.
Remember the store above, though: a cache that's too small can cost more memory than a bigger one, because every request carries its own compiled code. If PHP-FPM is using gigabytes and a request uses hundreds of MB right after WordPress loads, the cache is part of the reason.
6. Raise it. GridPane sets these per PHP version. Each command writes /etc/php/8.4/fpm/php.ini and reloads PHP 8.4, and its output lists the sockets it reloaded, which is also the list of sites sharing that cache:
gp stack php 8.4 -opcache-memory 512
gp stack php 8.4 -opcache-max-accel-files 20000
I aim for a cache that lands around 60% full, which is what the script's suggestion works out. If some sites had nothing cached, it scales up from the ones that fit, and it tells you that's a guess.
The text buffer has no gp command. It's a hand edit, with two traps. php.ini has two lines that match, and the one starting with ; isn't the live one. And the buffer is carved out of the cache's memory, so raising it alone shrinks the space for code. Raise memory in the same pass. I use 64 MB only on caches of 512 MB or more; on a smaller cache, go one step (8 to 16, or 16 to 32).
grep -n "interned_strings_buffer" /etc/php/8.4/fpm/php.ini
sed -i 's/^opcache.interned_strings_buffer *=.*/opcache.interned_strings_buffer=64/' /etc/php/8.4/fpm/php.ini
# check that the live line changed:
grep -n "interned_strings_buffer" /etc/php/8.4/fpm/php.ini
Then reload PHP 8.4. Running any of the gp stack php 8.4 -opcache-… commands does it, so I make the hand edit first and the memory change last. I don't know yet whether a GridPane stack update (GridPane's own updates to nginx, PHP and the rest of the server software) keeps the hand edit, so I check it after updates.
7. Check again a day later. A raised cache refills. On my biggest server, a PHP 8.3 cache raised to 768 MB was 97% full seven hours later, and needed 1024 MB. Check again after a big staging build, after a launch that changes the live site's theme or plugins, and after moving a site to another server. GridPane's migrations carried my sizes across, but a brand-new server starts every PHP version at 128 MB.
Why not run every site on the same PHP version?
The usual advice is to put everything on the newest PHP version you can. For speed and support, that's right. But on one server, putting every site on one version also puts every site in one cache, and the biggest or busiest site decides who else fits.
Splitting them across versions gives each group its own cache. One of my servers runs that way today:
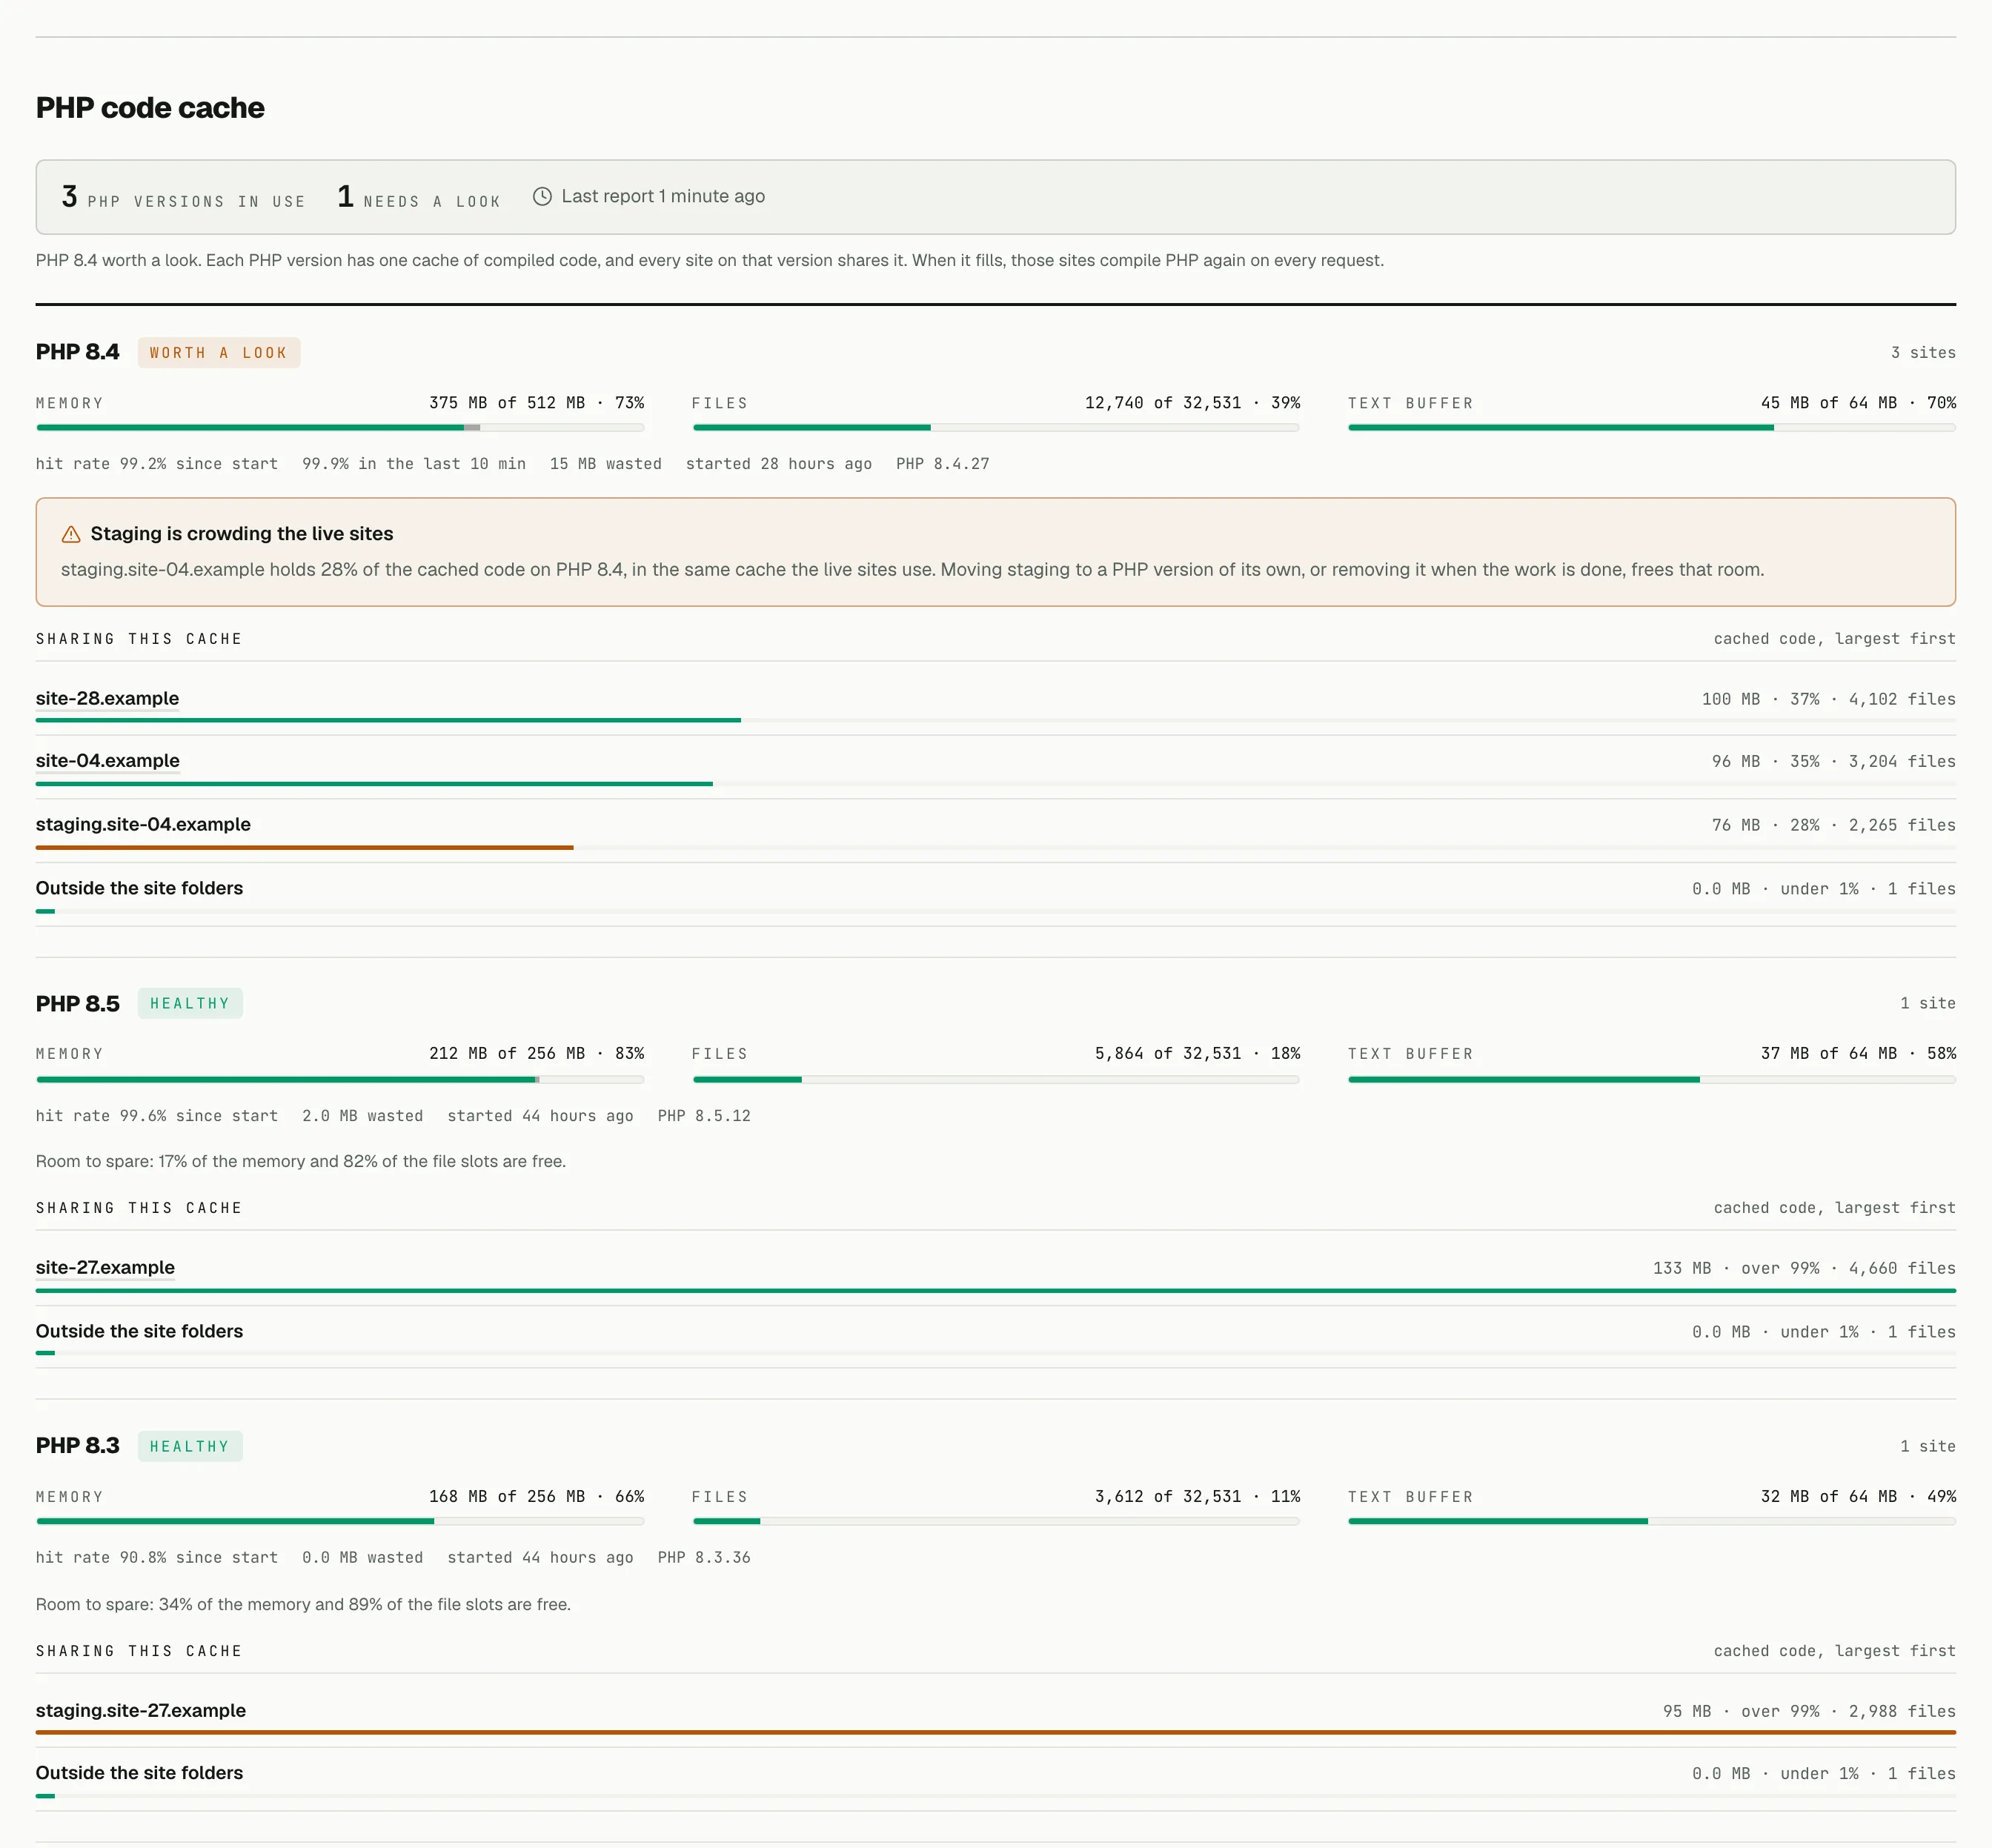
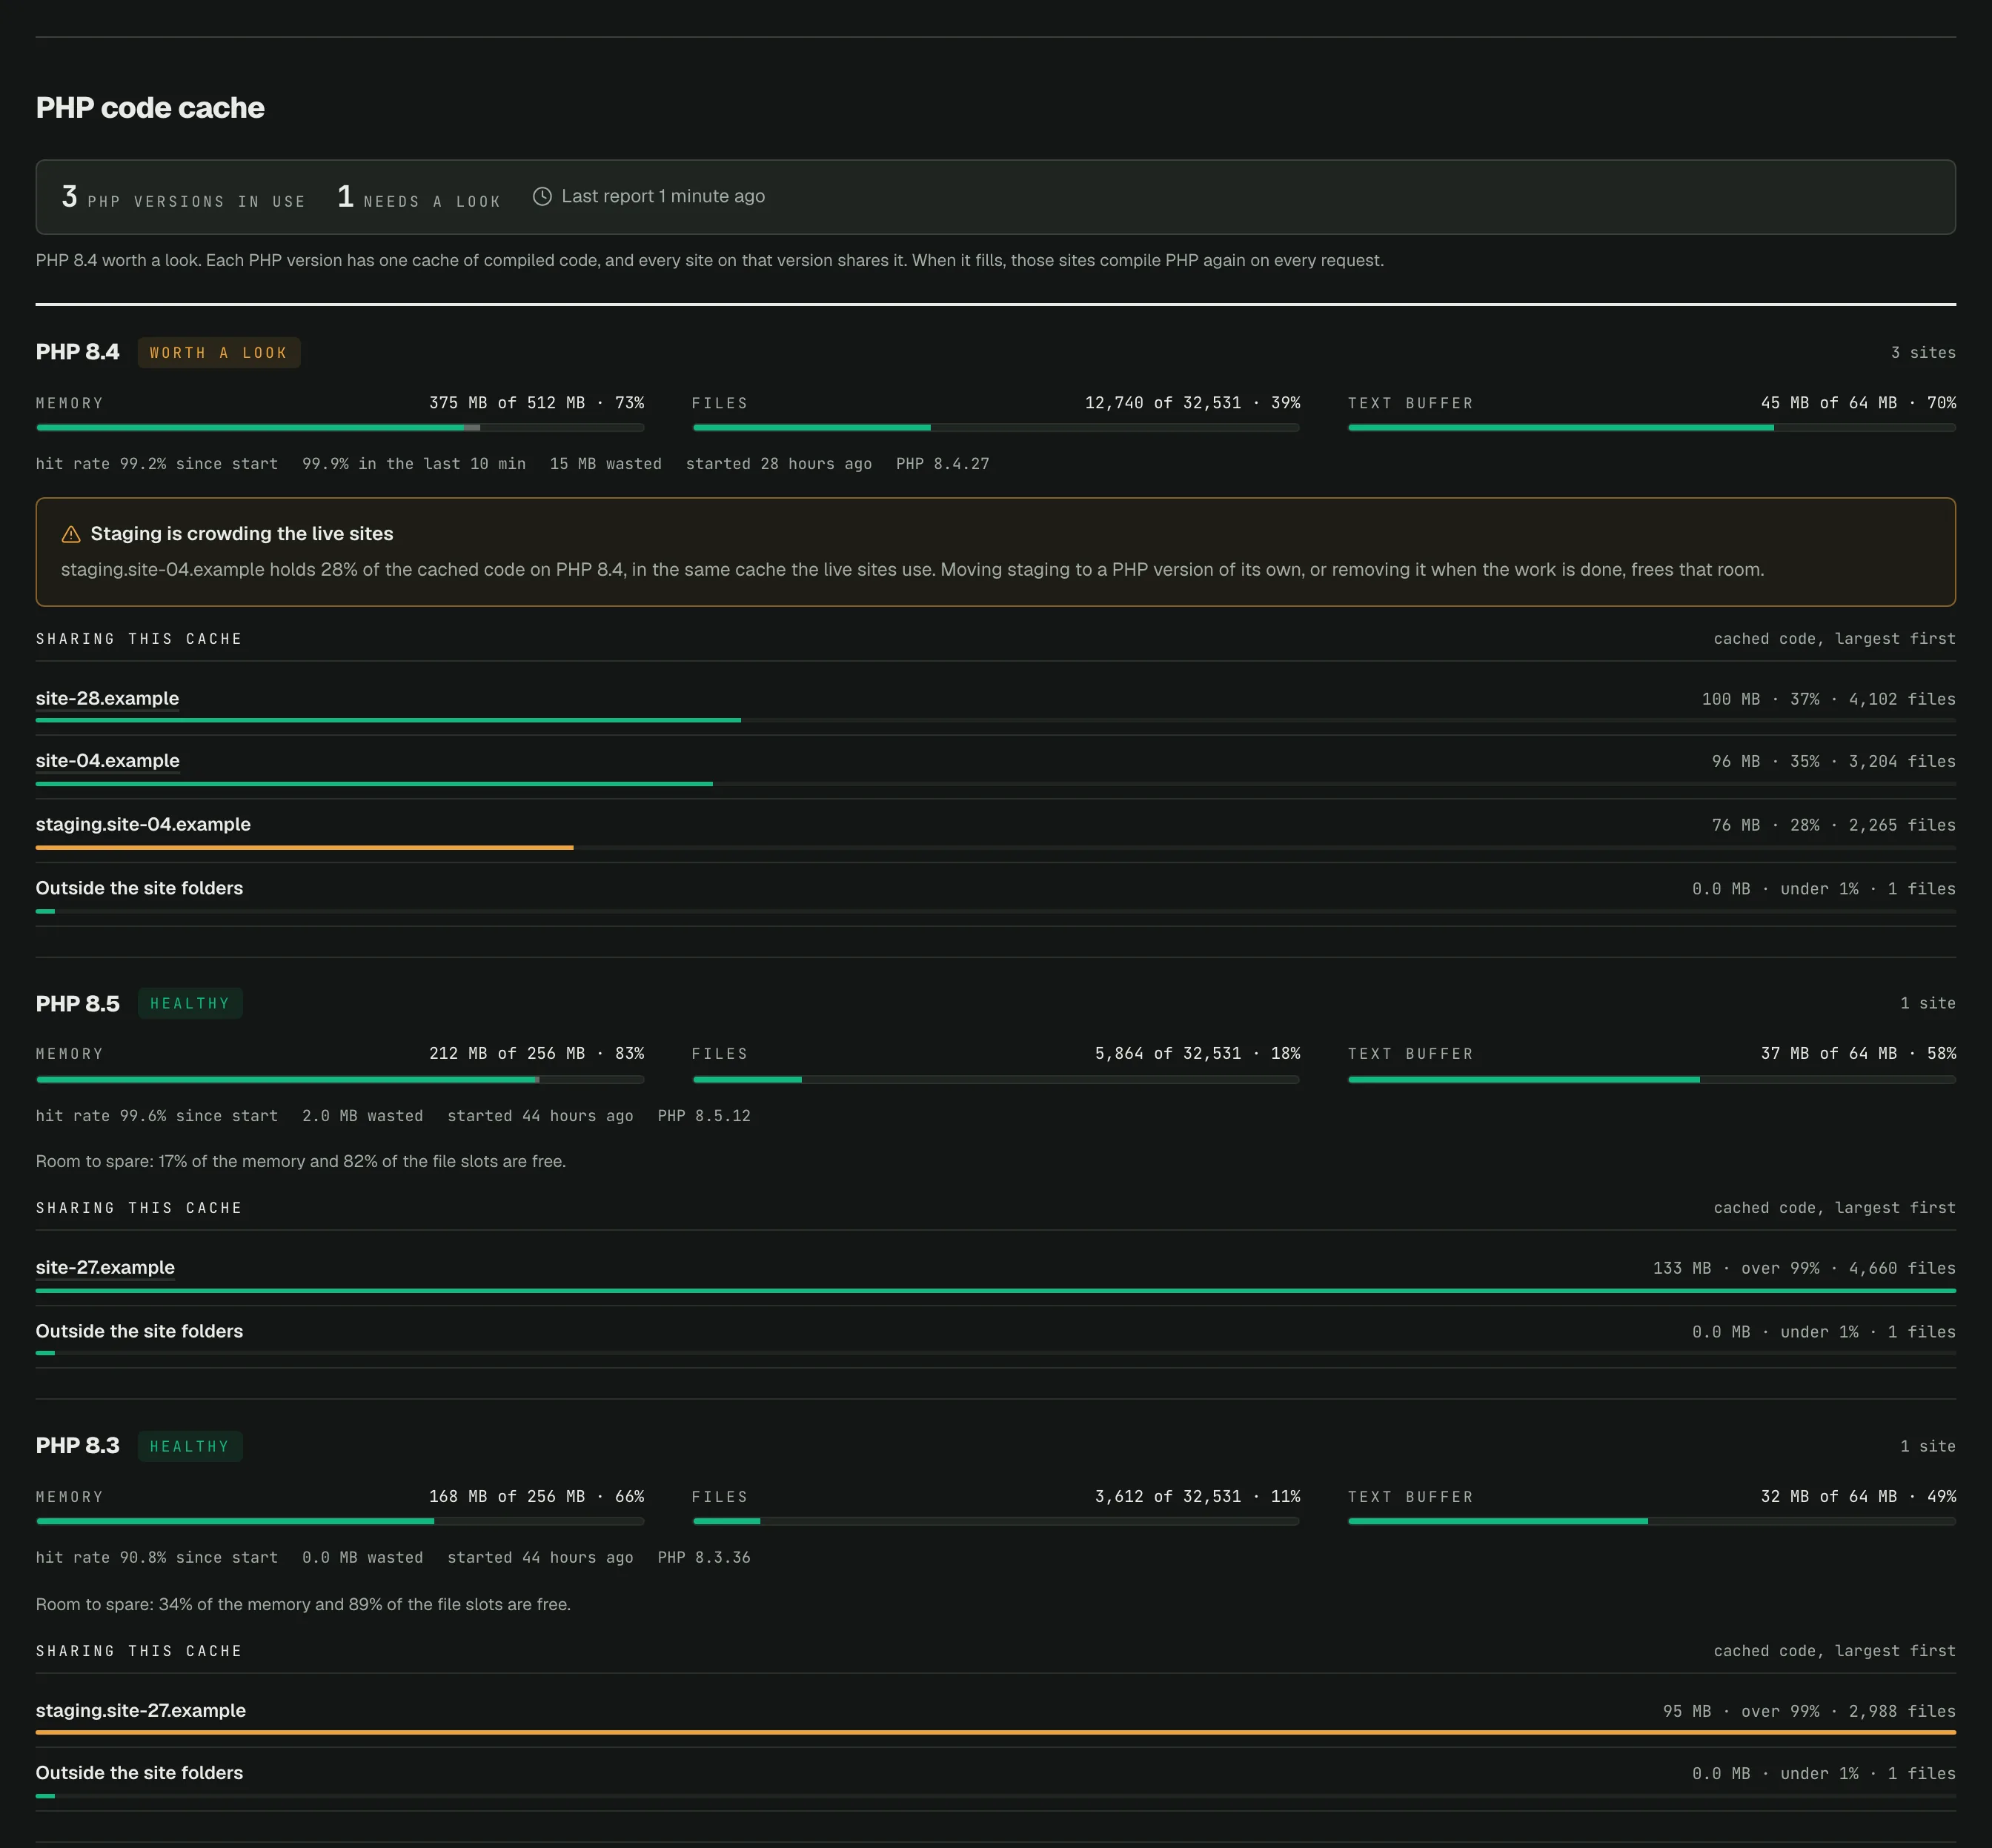
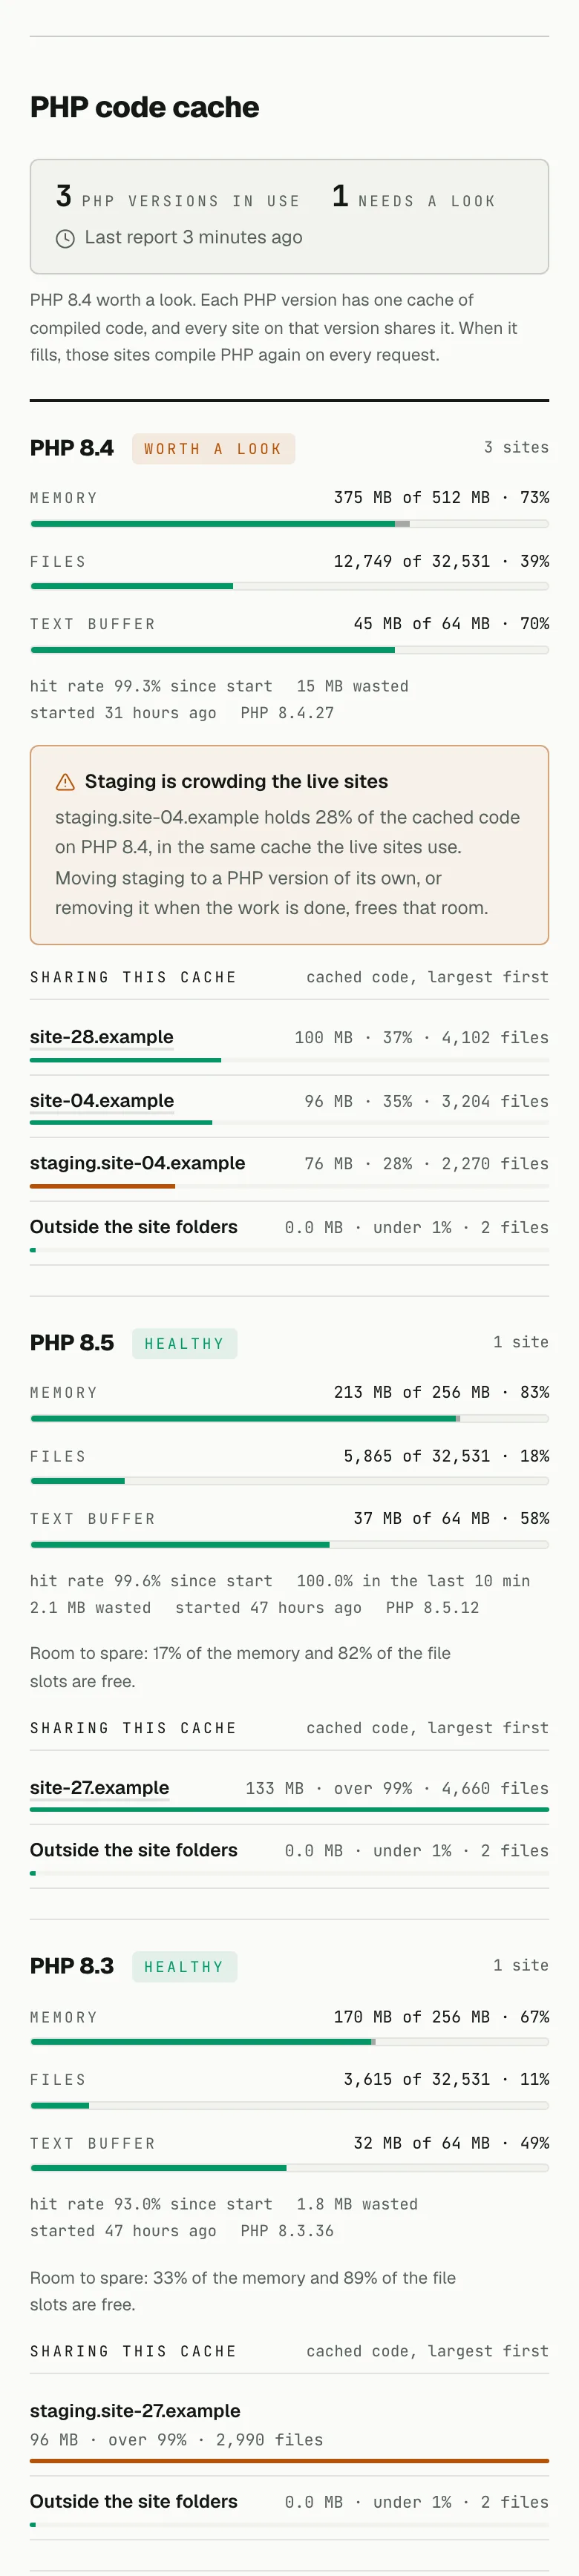
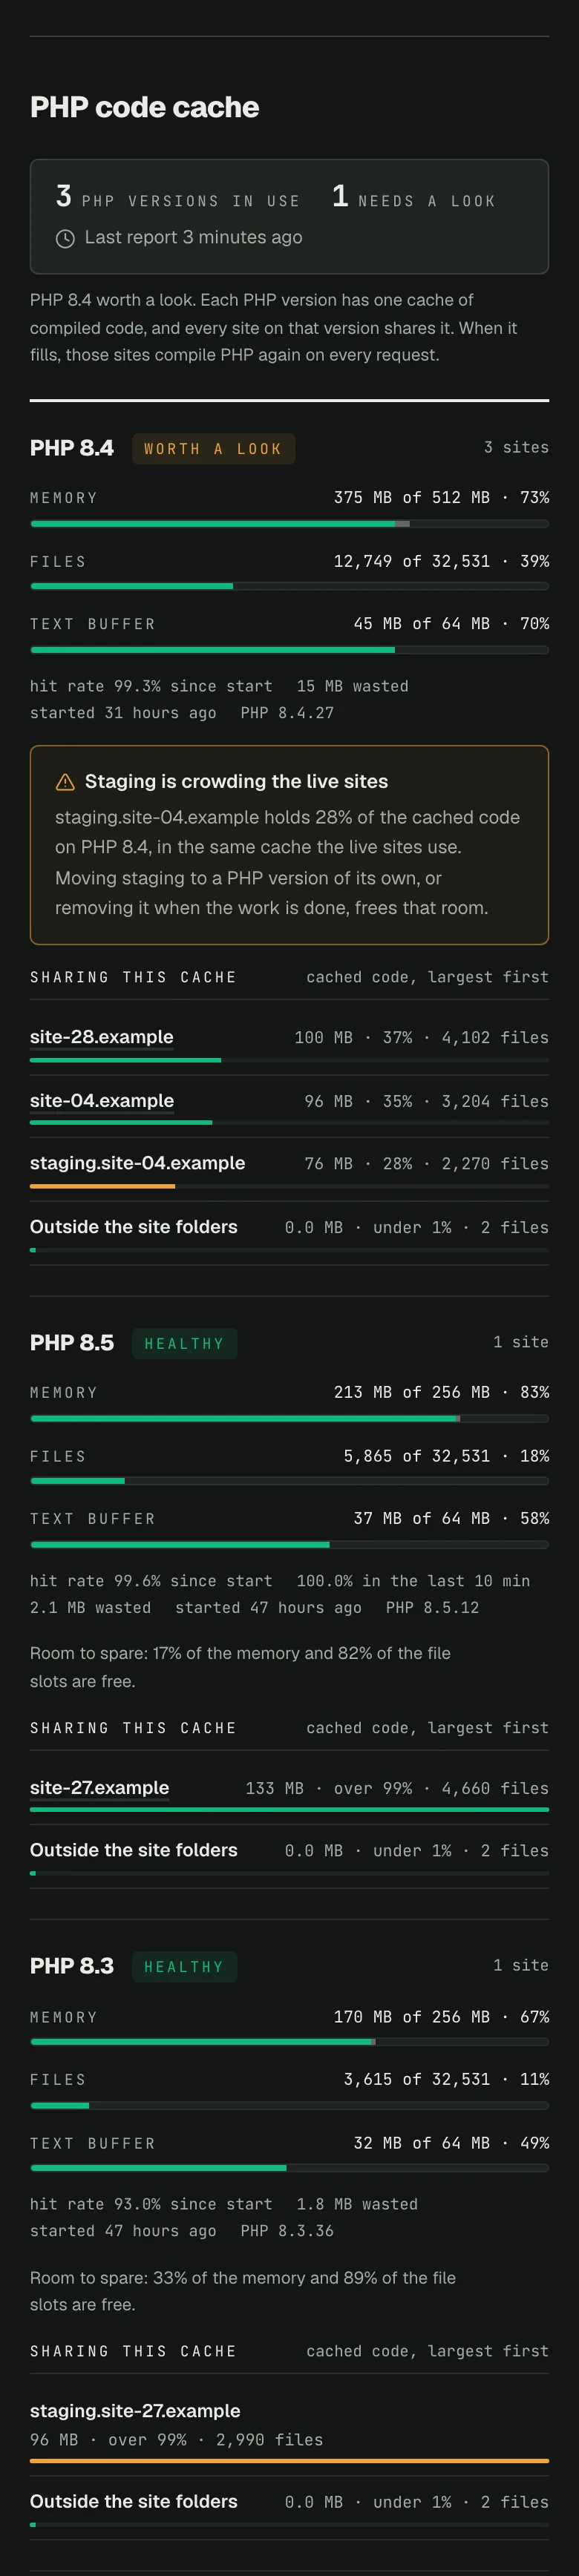
Two things are going on in that screenshot:
- On PHP 8.4, staging is crowding the live sites. A staging copy holds 28% of the cached code, in the same cache two live sites use. Here it still fits. On a smaller cache it wouldn't, and as the store showed, whichever loads first stays.
- On PHP 8.5 and 8.3, one site is split. The live site runs alone on 8.5 with 256 MB to itself, and its staging copy sits on 8.3. A staging build on 8.3 can fill that cache all day without touching the live site's cache.
That split is the cheapest fix for the staging problem. While a staging copy is being built, run it on a PHP version no live site uses, and delete the copy when you're finished.
It comes with costs, and they're worth knowing before you do it:
- Each version is its own block of RAM, and each needs sizing. Three versions at 512 MB are 1.5 GB. Splitting doesn't make the code smaller; it decides who competes with whom.
- Settings don't follow a site. Each PHP version has its own
php.ini. When a site moves to a version that's never been sized, it lands in a 128 MB cache. - Staging on another version isn't testing on live's version. While you're building pages, that rarely matters. Before you test something that depends on PHP itself, switch staging back to live's version, or test on a copy that matches.
- Idle versions still run. GridPane keeps every installed version up for its own tools, with a nearly empty cache. They cost little, but they show up in any check, so don't mistake them for sites.
How did the rollout go?
Fleet's agent, a small program on each server that reports to the dashboard, already ran every ten minutes. I added the OPcache read to it on November 15 (UTC), and the first read from all ten servers came back within the hour:
- 13 of the 20 PHP versions in use had a full cache. 12 of them were at 128 MB.
- On my biggest server, PHP 8.3 had code from only 2 of its 9 sites, with a 36% hit rate. On a 4 GB server, PHP 8.4 had code from 2 of its 6 sites, with an 18% hit rate.
- Two servers had plenty of cache memory but a full text buffer.
- The three servers I had already raised for the store cases were the healthy ones.
I raised them that day, one PHP version at a time, from a script per server. Each script stopped if the server's available memory was under its floor, backed up php.ini, made the change, checked that PHP's own test of its config files passed and every site still answered as before, and put the backup back if anything failed. It never had to.
I left one cache full on purpose. A 4 GB server needed about 768 MB on PHP 8.3, and with its other version raised too, that would have put about 1 GB of cache on 4 GB of RAM. Its hit rate was still 99.9%, so it waited for a bigger server. Moving it to 8 GB is the right fix, not squeezing.
Several of these servers have since moved to new, larger machines, which is why Fleet lists more than ten right now: old and new overlap until each move is finished. The panel is how I re-check each one after a move. Two caches on the new machines were full at 512 MB and went to 1024 MB.
What does the dashboard show?
The panel is on each server's page in Matchless Fleet, one block per PHP version: memory, file slots and text buffer as bars, the hit rate since start and over the last ten minutes, and every site sharing that cache with its share of the cached code. Staging rows are colored differently. When something needs changing, the panel says what and gives the command to run. The dashboard itself never changes a server.
In the first shot, PHP 8.3 reads healthy with a 69% hit rate. That's on purpose: three of its four sites have nothing cached at all, so the version sees little traffic, and the panel doesn't judge a hit rate since start until it covers 10,000 file loads. A version no site uses says "Not in use" instead of raising an alarm about its empty cache. When the agent can't read a version, because PHP refused or didn't answer, the panel never calls it healthy: it says "Cannot see" and gives the reason.
Each site's page carries one line: which cache it shares, with how many other sites, how full it is, and how much of it this site's code takes.
What should I tell an AI agent doing this?
If an agent runs this for you, keep it read-only until you've seen the numbers. Copy this into your agent:
Check PHP's code cache (OPcache) on this GridPane server, for every PHP version, and
tell me whether each one is big enough.

Follow the steps under "How do I check it on my own GridPane server?" at
https://jonphillips.dev/posts/gridpane-opcache
with these rules:

1. Read-only until I say otherwise. Download opcache-check.py from that post, read it,
   and tell me what it does before you run it. Run it as root. Do not run any gp stack
   command, edit php.ini or reload PHP.
2. Do not judge the cache with wp eval or php -r. The command line has its own, separate
   cache. Only a request through a PHP-FPM socket sees the real one.
3. Report per PHP version: memory taken, file slots, text buffer, hit rate, which sites
   share it, and any live site with nothing cached. Run it again with --sample 60 if the
   hit rate since start looks fine but a cache is full.
4. If a version reads "cannot see", say so and why. Never report it as fine.
5. Run free -m. For each change you propose, say how much RAM it adds and what the
   server has available. Every PHP version's cache is its own block of memory.
6. Propose the exact gp stack php commands, and the text-buffer hand edit if needed
   (the live line, not the commented one). Then stop and wait. I run them, or I tell you to.
7. If a staging site holds a large share of a cache the live sites use, say so, and
   offer the options: a PHP version of its own, or deleting it when the work is done.
8. When you are done, run opcache-check.py --clean.
What's still open?
Everything here was measured on my own servers. The script has run on a test PHP-FPM and on one of my GridPane servers, where its numbers matched the dashboard's and --clean left nothing behind. I'd like a few readers to try it on theirs and tell me where it trips.
I haven't checked whether a GridPane stack update keeps the hand-edited text buffer. Until I know, I re-read it after updates.
And the caches I raised need a settled re-check after a few days of normal traffic, not just the hours after a reload. With the panel, that's a quick look.
Stack: GridPane's PHP-FPM 7.4 to 8.5 on Ubuntu, OPcache's own opcache_get_status(), a Python FastCGI reader with no dependencies, Supabase (the database behind Fleet), and Matchless Fleet for the panel. Every change was a gp stack php command run by a person over SSH.

Jon Phillips builds websites, web apps and automations at Matchless Web (opens in a new tab) in Clinton, Mississippi.