~/writingmatchless-fleet-gridpane-dashboard
How my GridPane dashboard works, and where GridPane's API stops
Matchless Fleet is the private app I run my GridPane servers from. A page-by-page tour: what syncs with GridPane, what's display only, and what's still copy and paste.
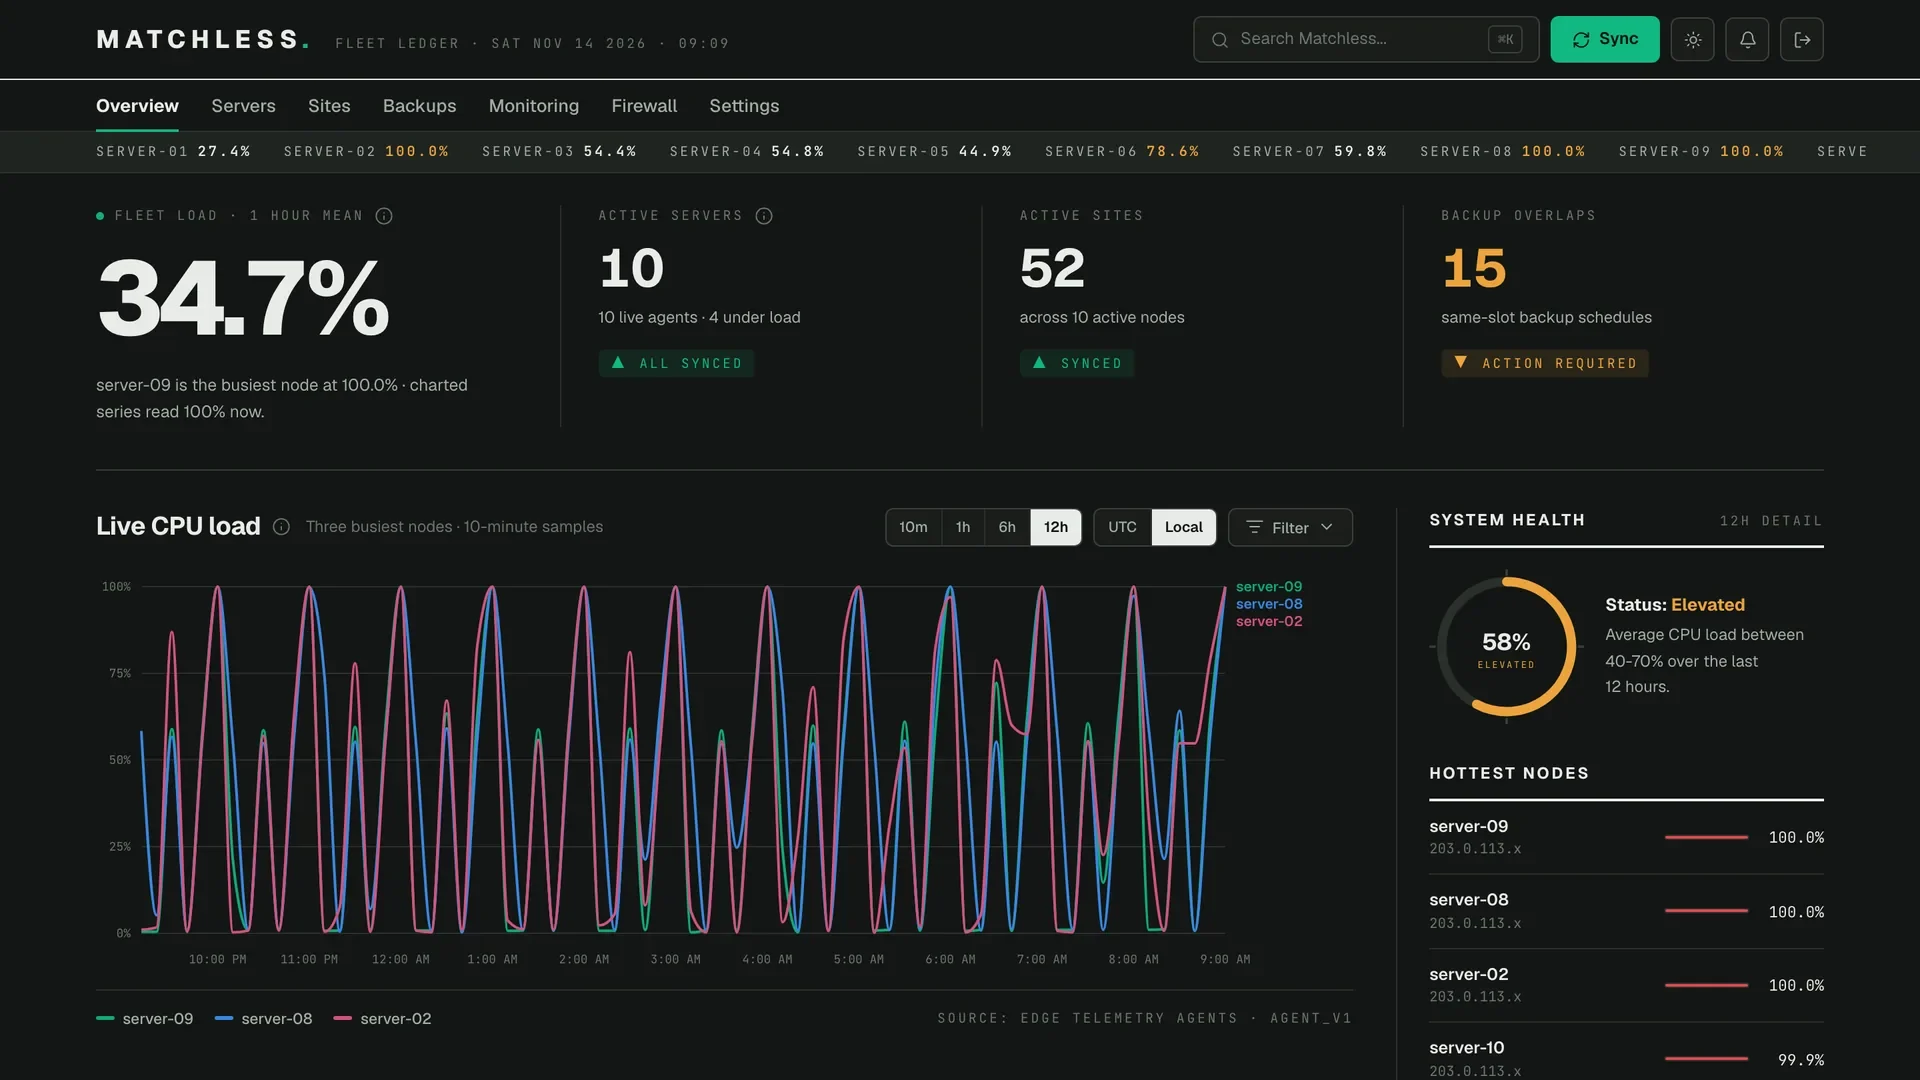
Matchless Fleet is a private app I built to manage my WordPress servers and sites on GridPane. Last week's post showed two of its screens. A few people asked for the rest, so this is the full tour, written for other developers: every main page, where each number comes from, which parts actually change something in GridPane, and which parts GridPane's API won't let any app touch.
The short answer to "why not just use GridPane's dashboard?" is that I still do, for some things. But I run just over 50 sites across 10 servers, most of my checking happens on a phone, and I wanted one place that shows the servers, the backups, the firewalls and Cloudflare together, in light or dark mode, and tells me plainly when something it shows isn't live.
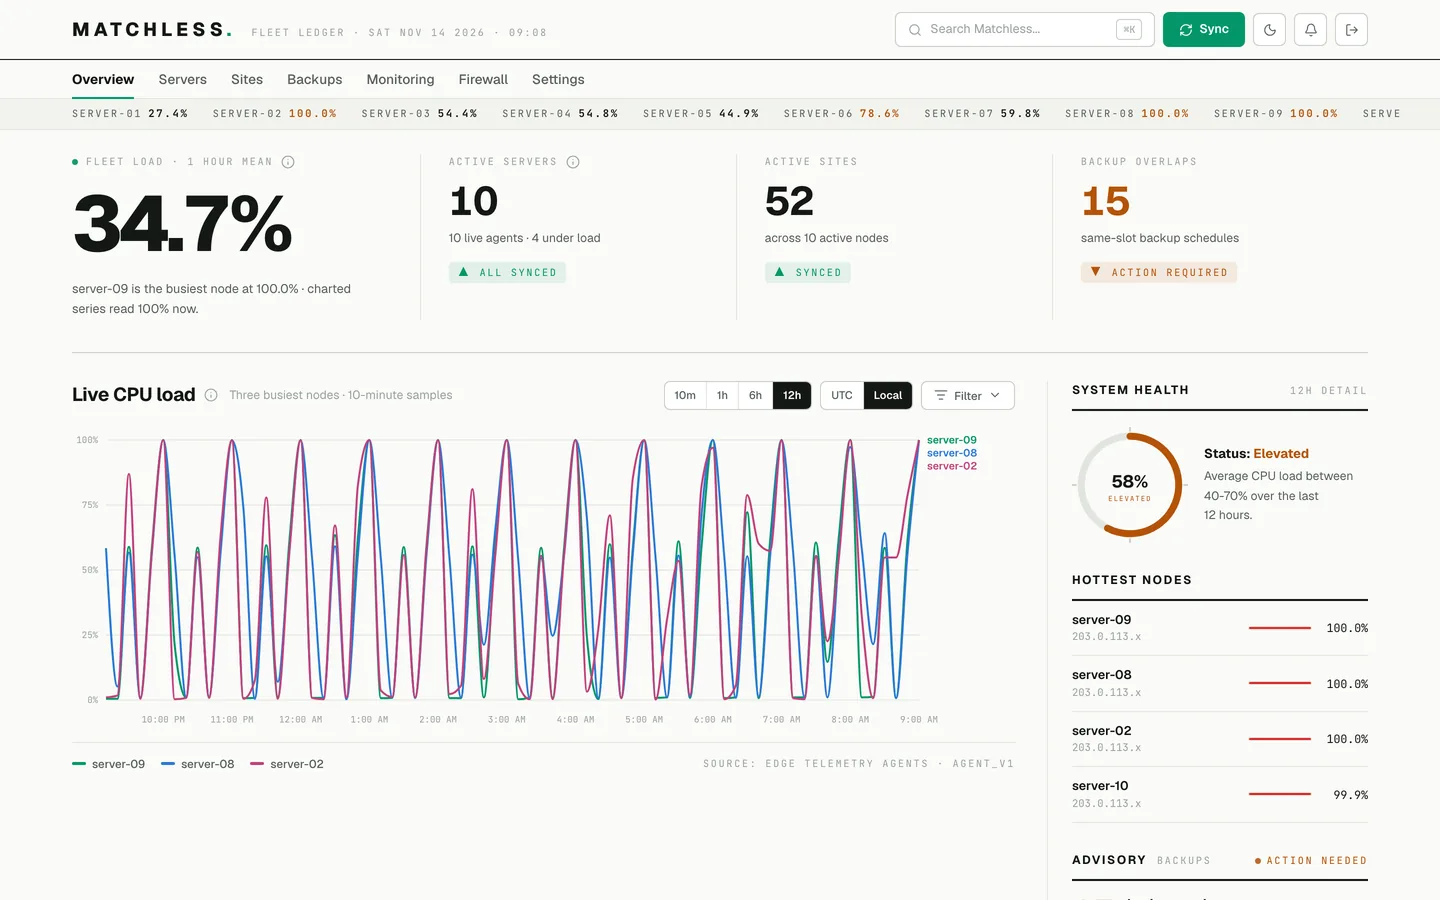
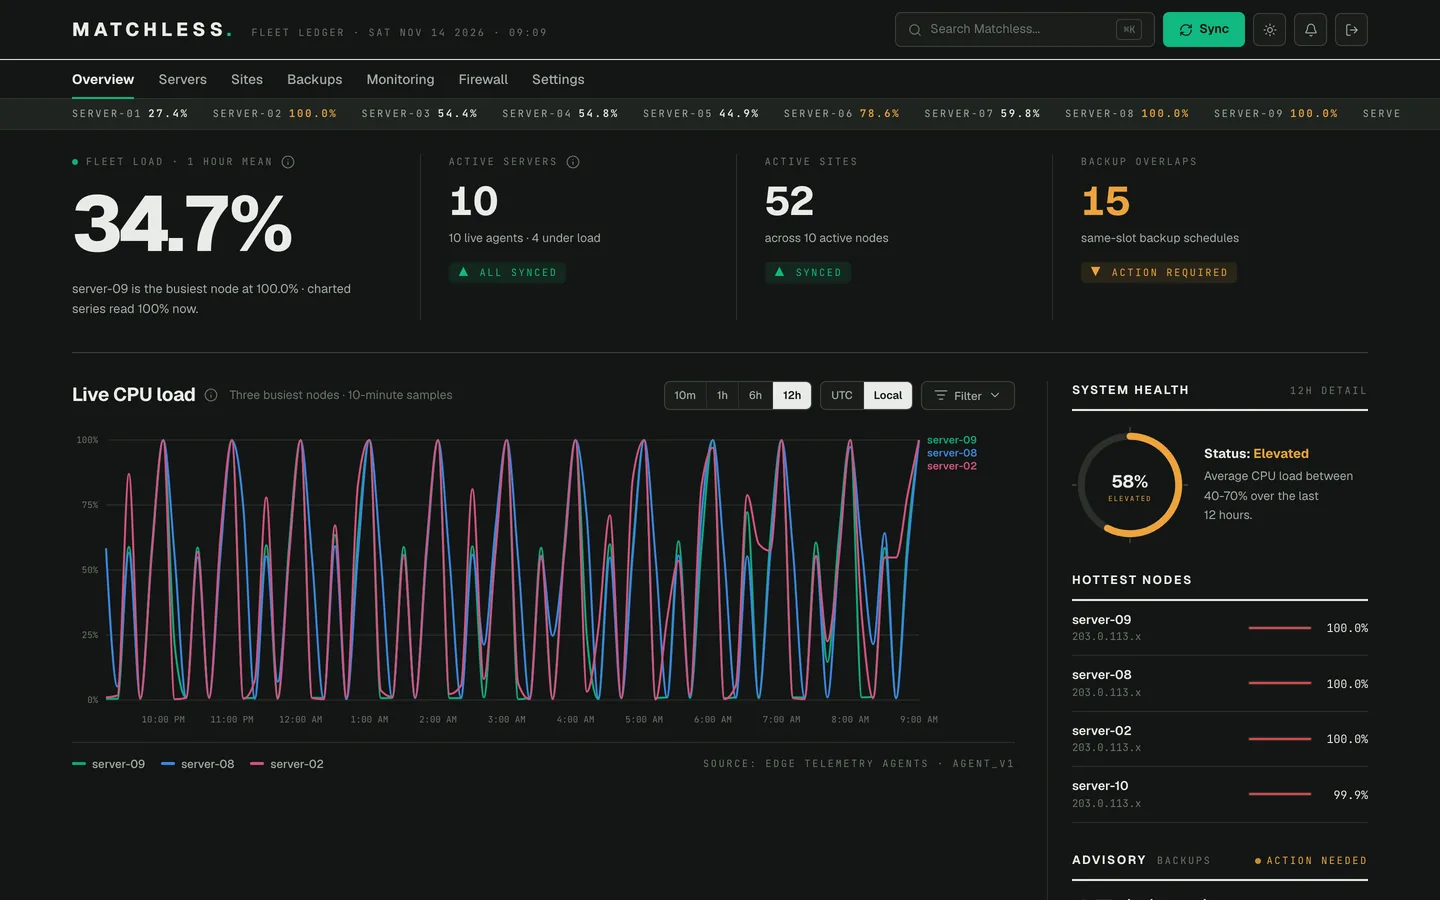
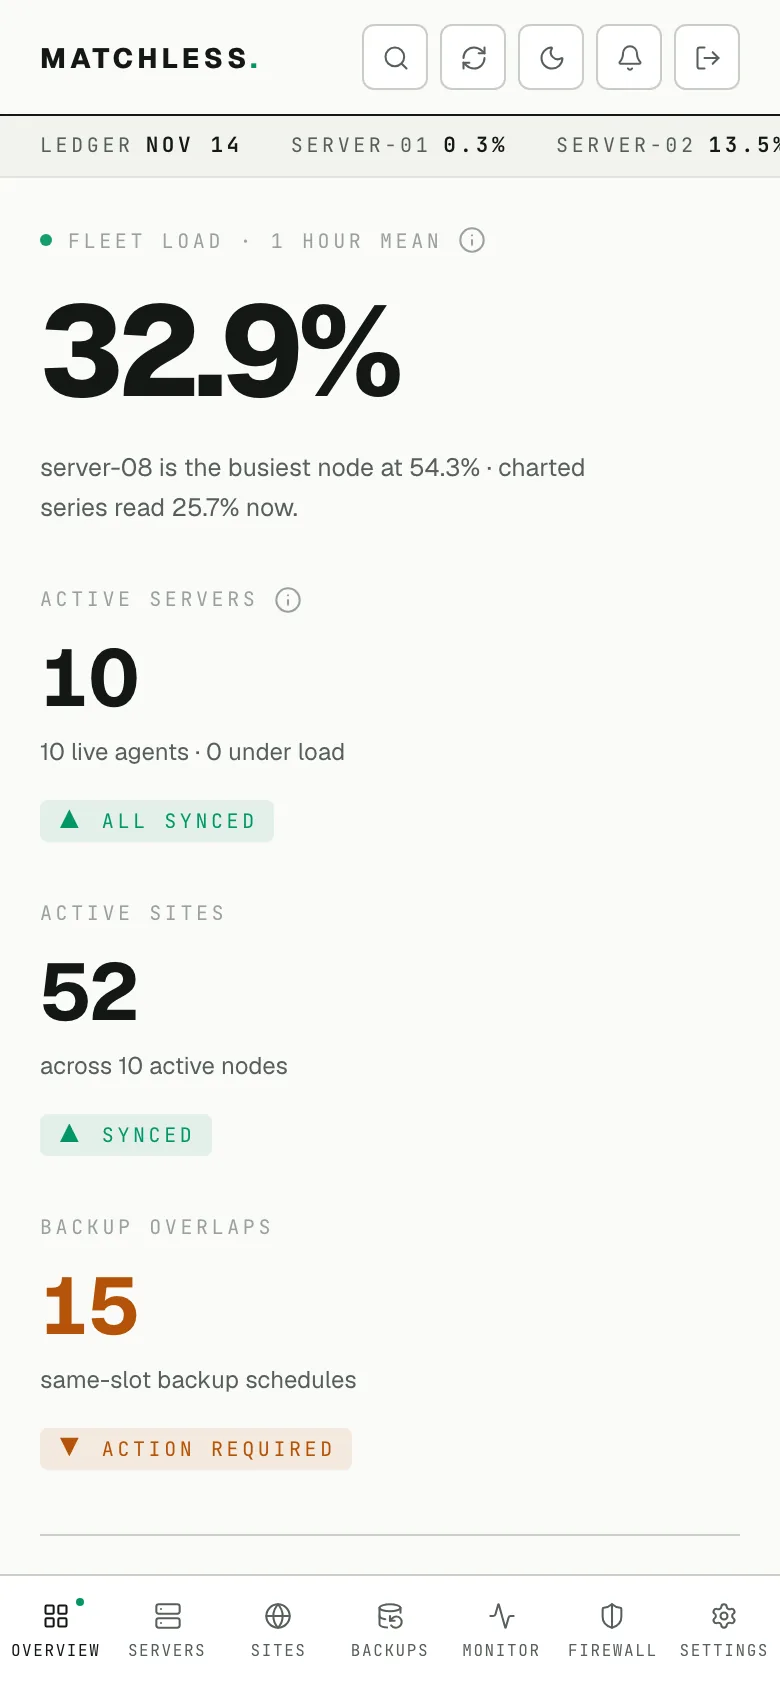
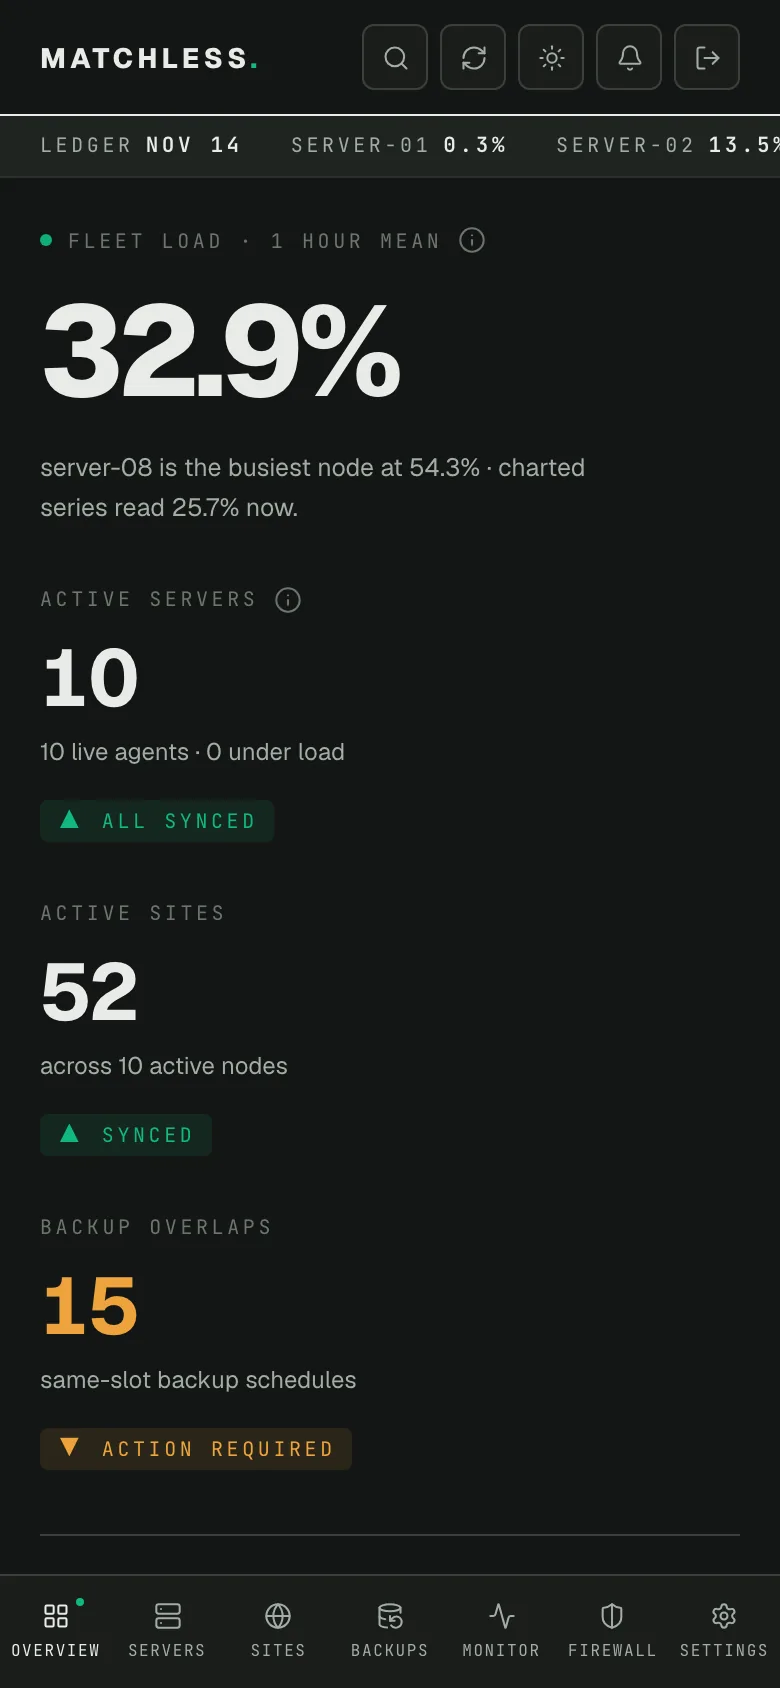
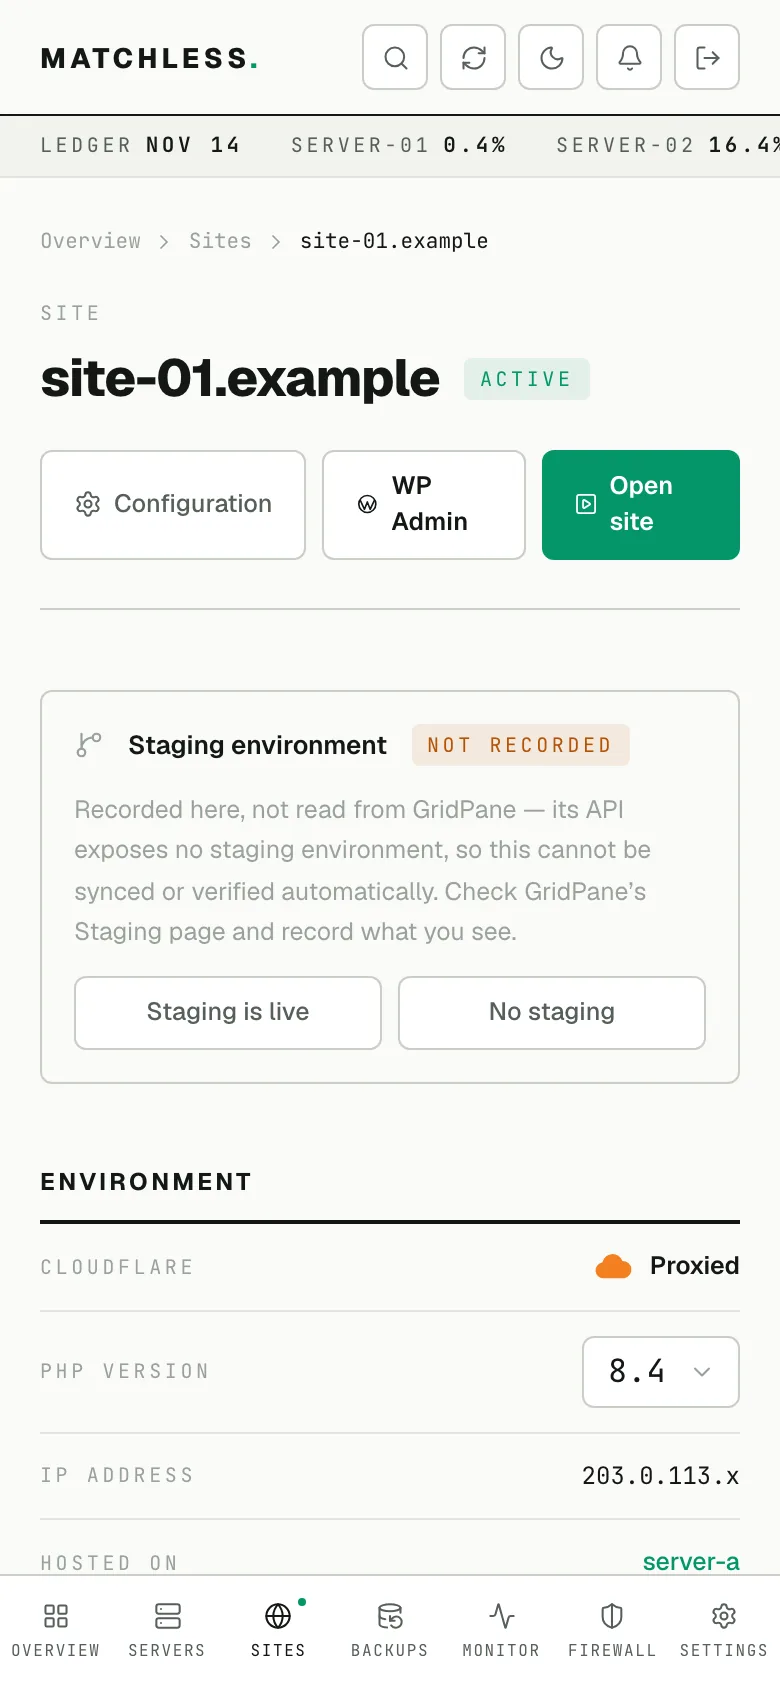
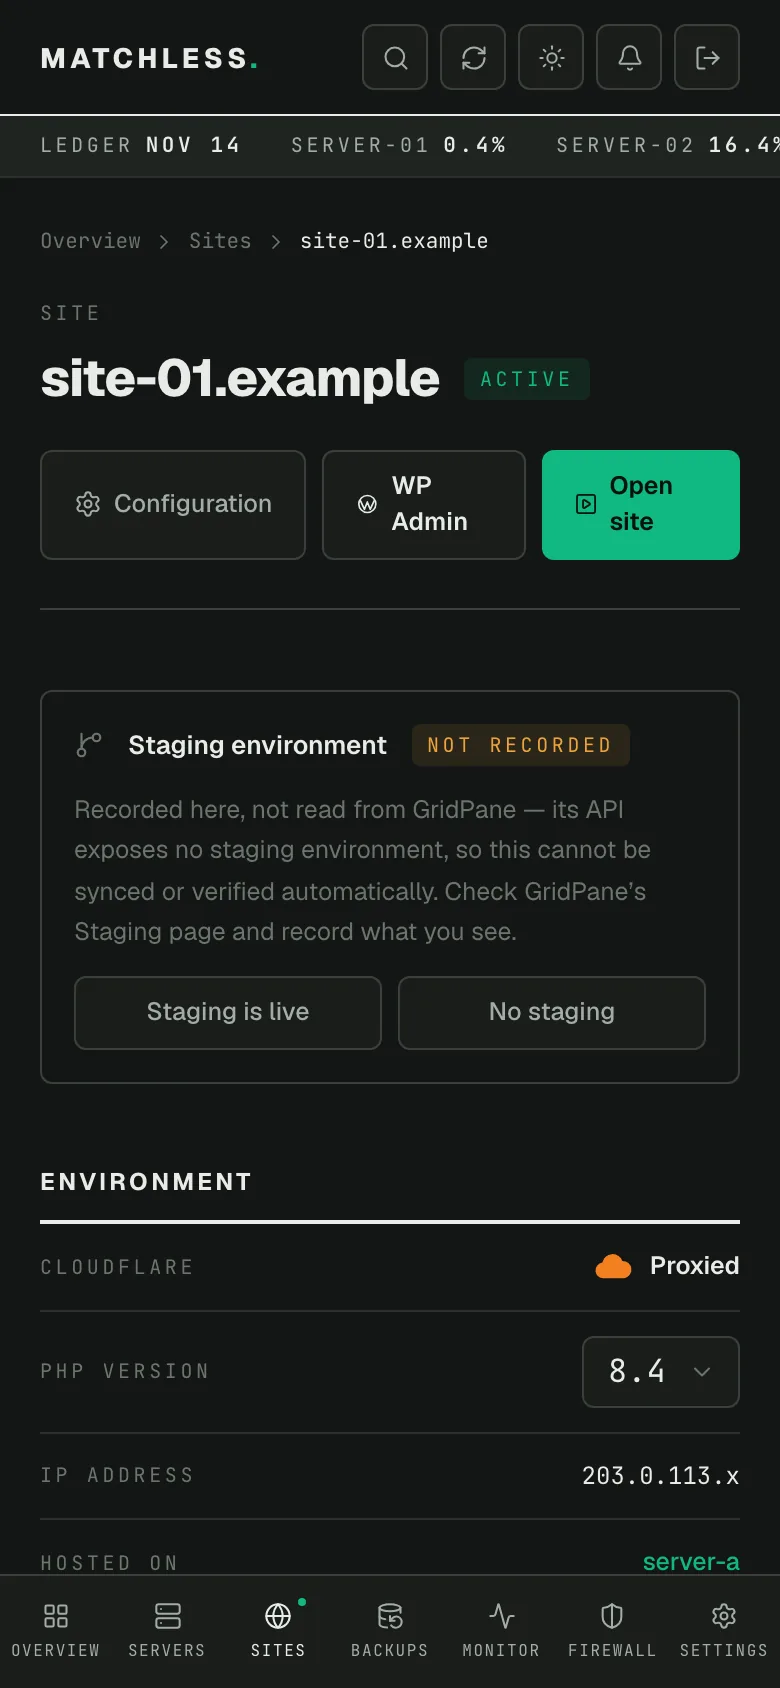
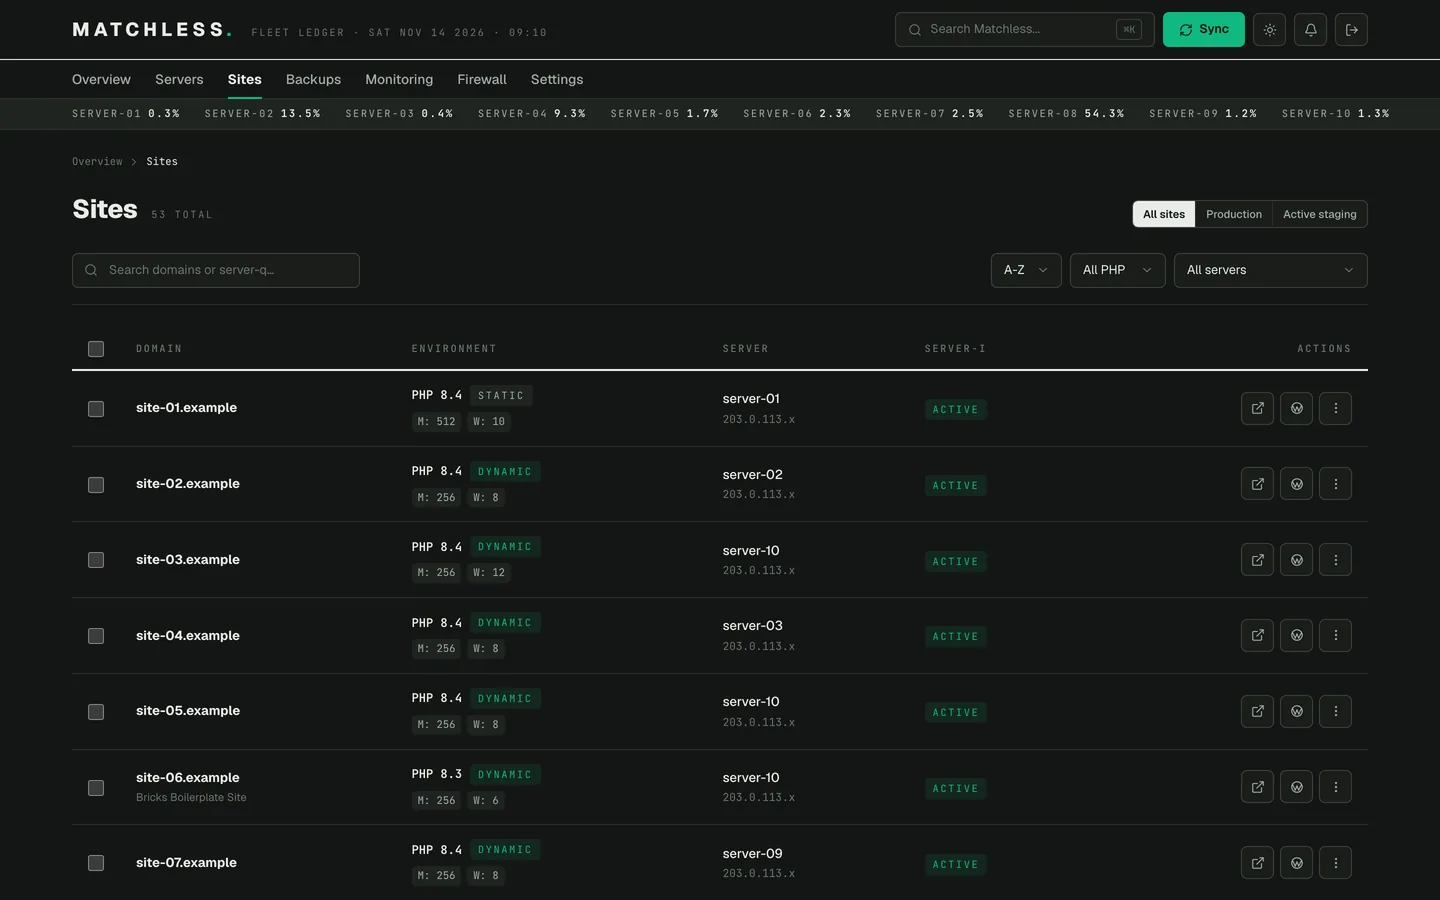
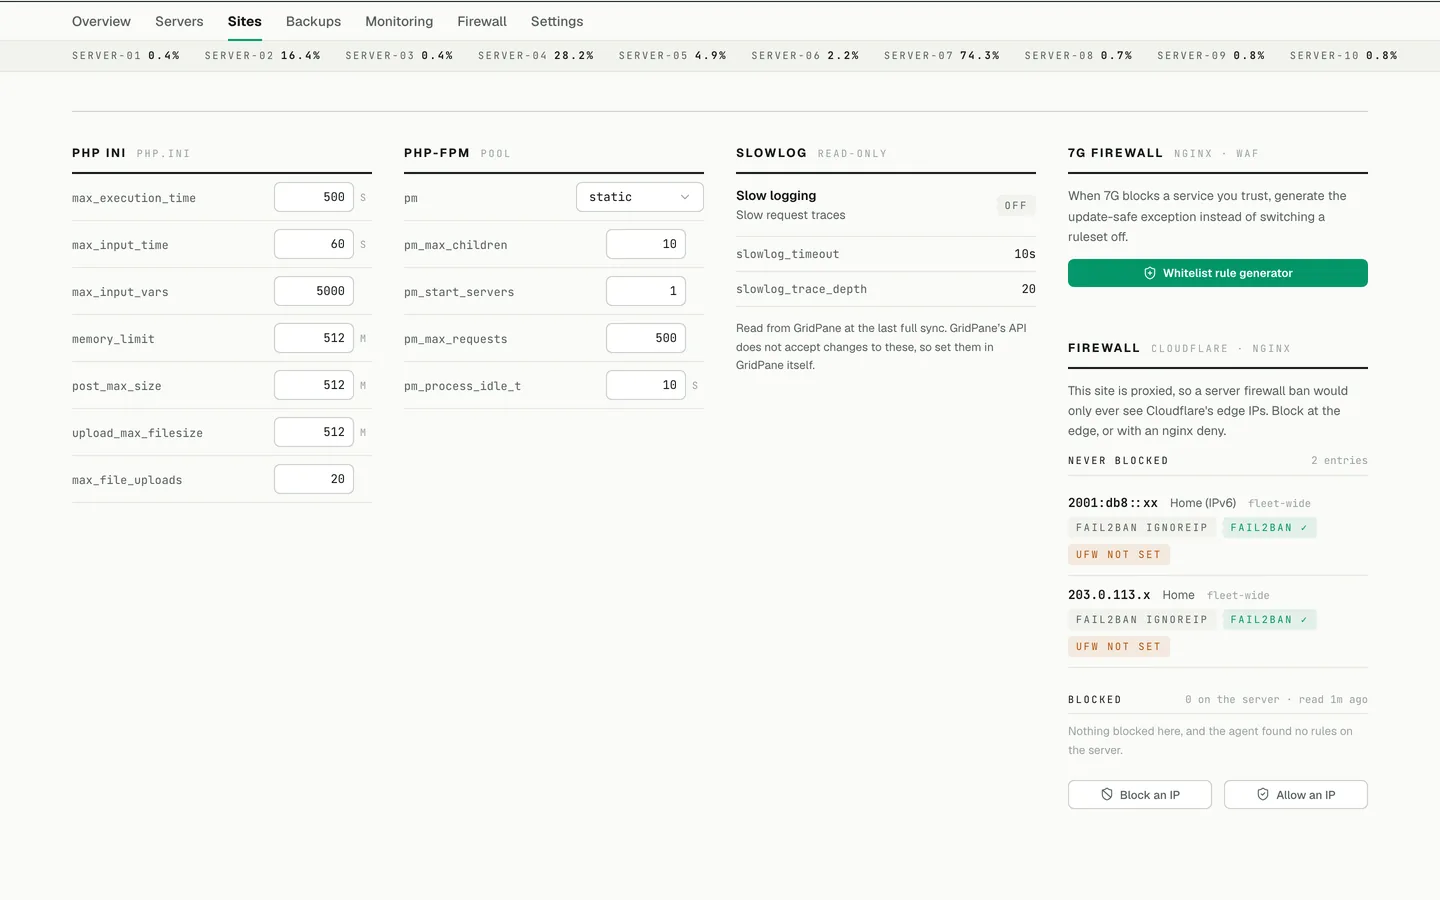
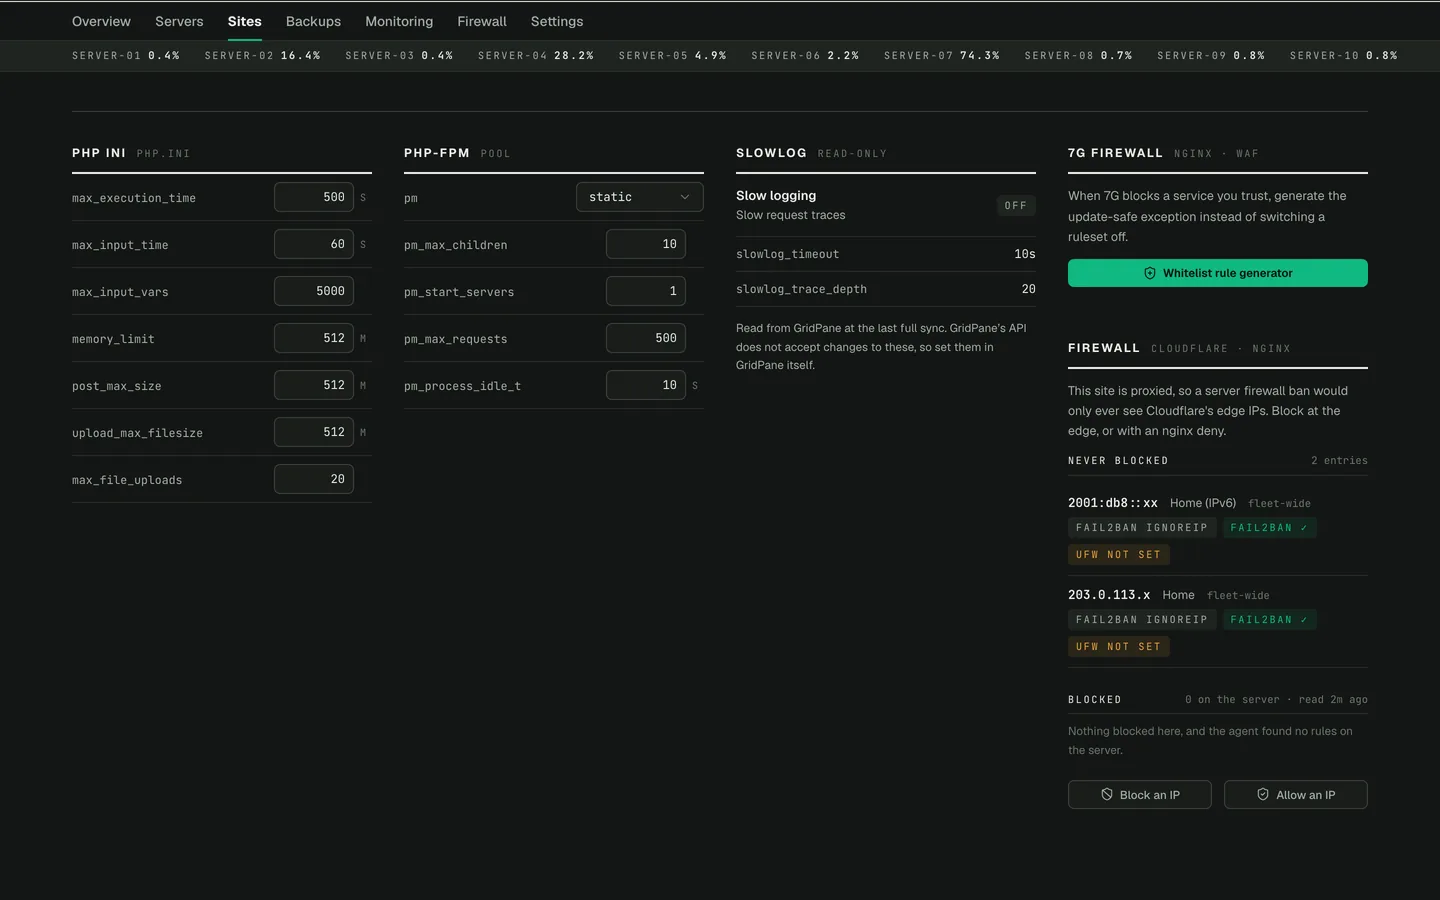
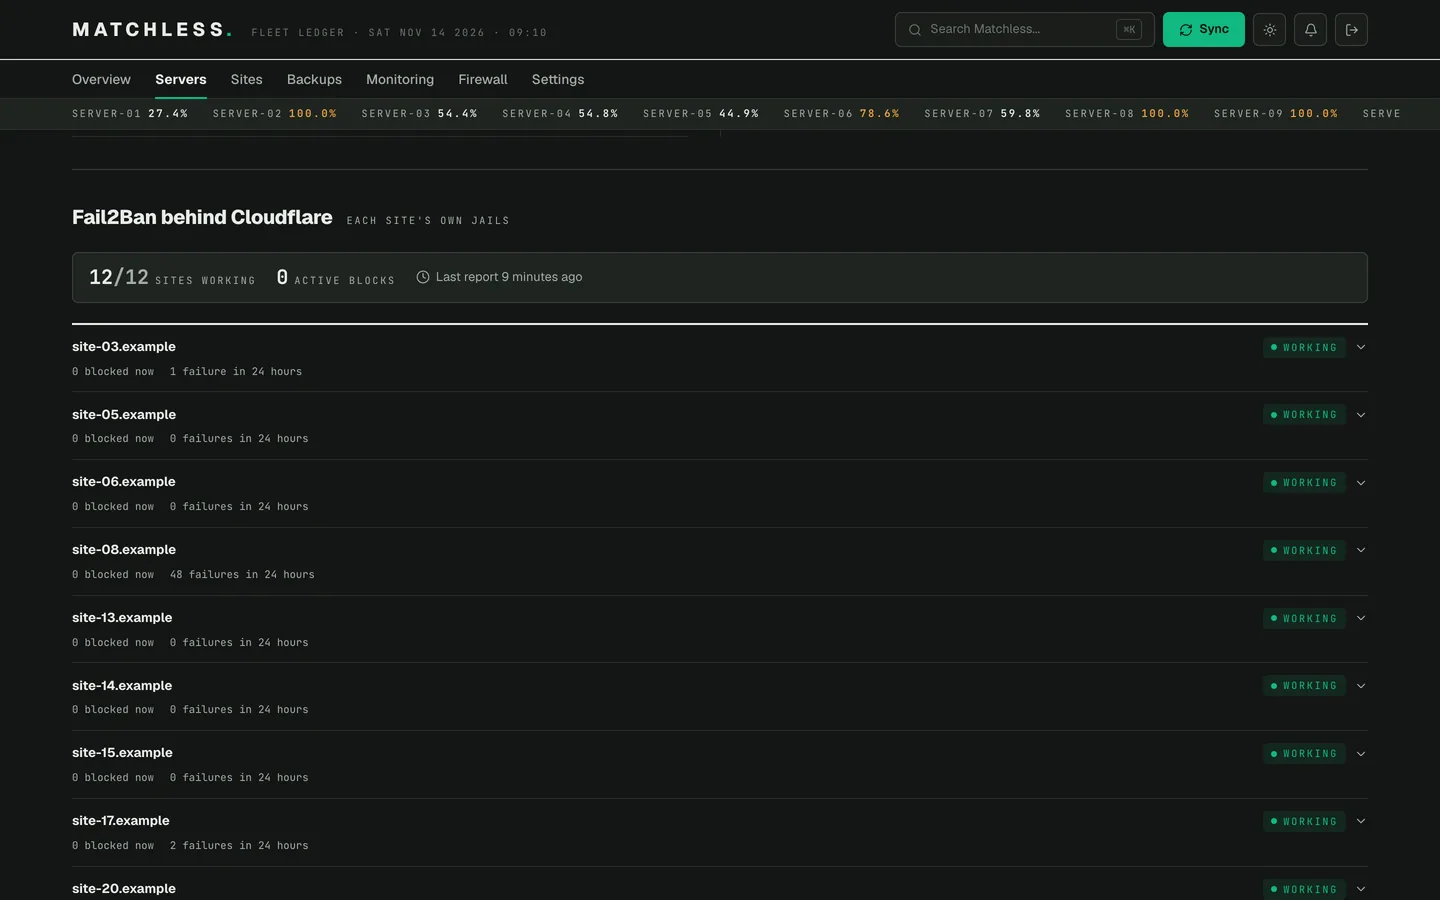
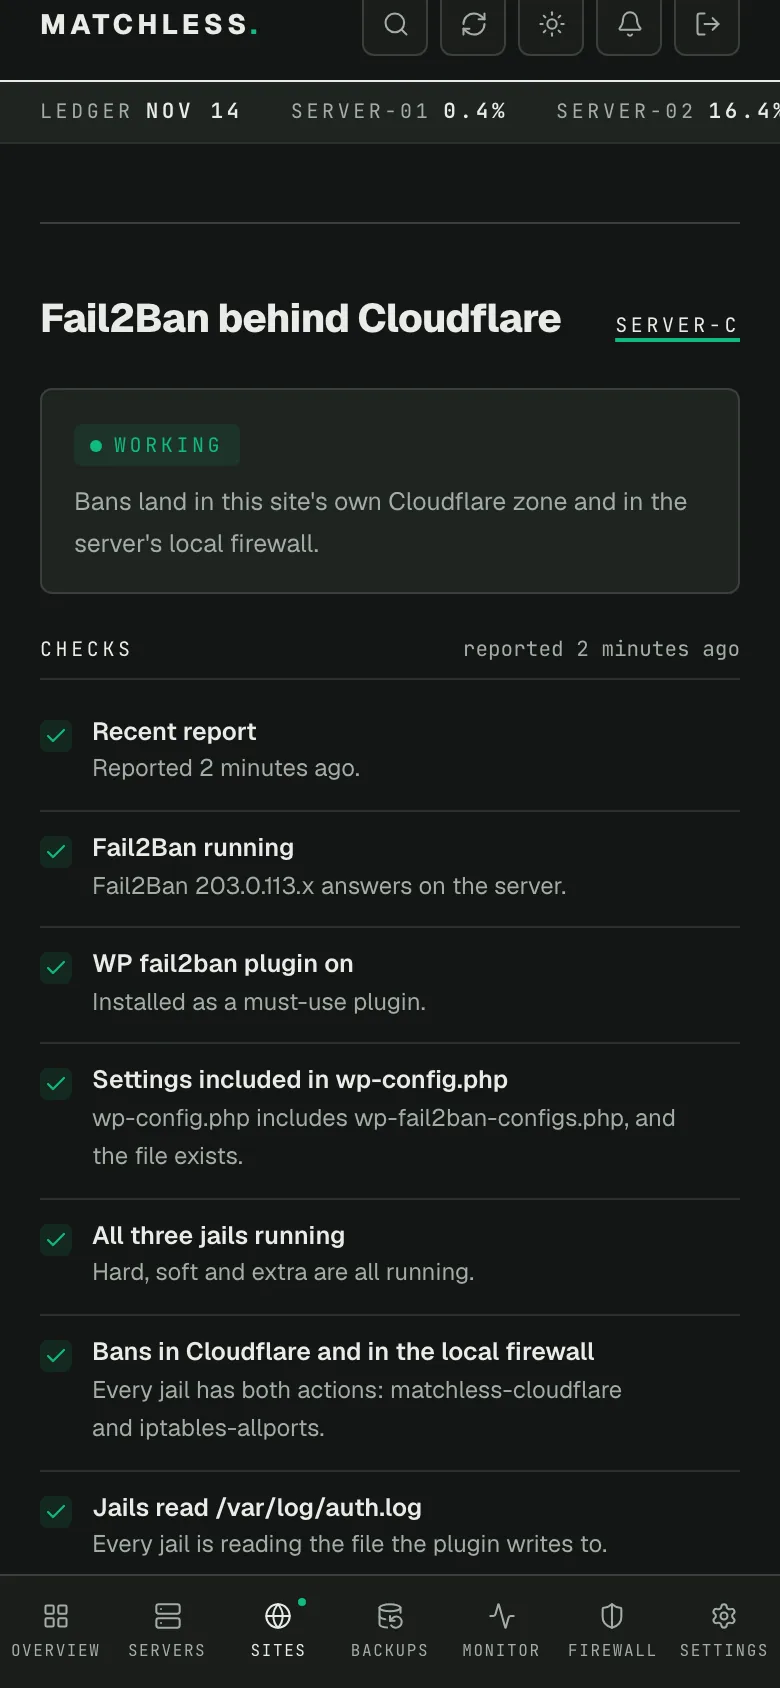
Drag a handle to compare light and dark mode. Every server name, site, domain and IP address in these screenshots has been replaced.
Where the data comes from
The browser never talks to GridPane. Every page reads from a Supabase database, and four things fill it:
- A sync from GridPane's API. The Sync button at the top of every page reads every server, every site and every site's backup schedules, and saves them. I can also run the same sync from my Mac. It runs when I ask for it, not on a timer.
- My own agent on each server. A small bash script runs from cron every 10 minutes. It reports CPU, memory, disk use, the top processes, the firewall's state and Fail2Ban's state. It only sends; it never takes instructions back.
- A daily job on my Mac. At 6:15 each morning it reads every Cloudflare zone I manage with a read-only token and loads a report of each zone's firewall rules.
- Things I record by hand. Where no API exists, the app keeps its own record, and the page says so in words.
And the app changes things in GridPane in exactly two places: a site's PHP settings, and the times of its backups. Everything else it shows, it shows. Nothing on the dashboard can run a command on a server.
The pages
Overview
The overview is the page I open first: the fleet's average CPU load over the last hour, how many servers and sites are up, how many backup schedules overlap, a live CPU chart for the busiest servers, and a feed of recent events. A ticker under the menu shows each server's current CPU like a stock price. The load figures come from my agent, not from GridPane.
Servers
The servers list comes from GridPane's server list, with CPU, memory and disk meters from the agent next to each one. A server's page stacks its hardware, the sites it hosts, its firewall, its 7G log retention and its Fail2Ban status.
The hardware is measured by the agent because GridPane returns no CPU or memory figure for a server it didn't provision (a "custom" provider server). After the agent went out, its numbers matched GridPane's on every server where GridPane had numbers at all.
Sites
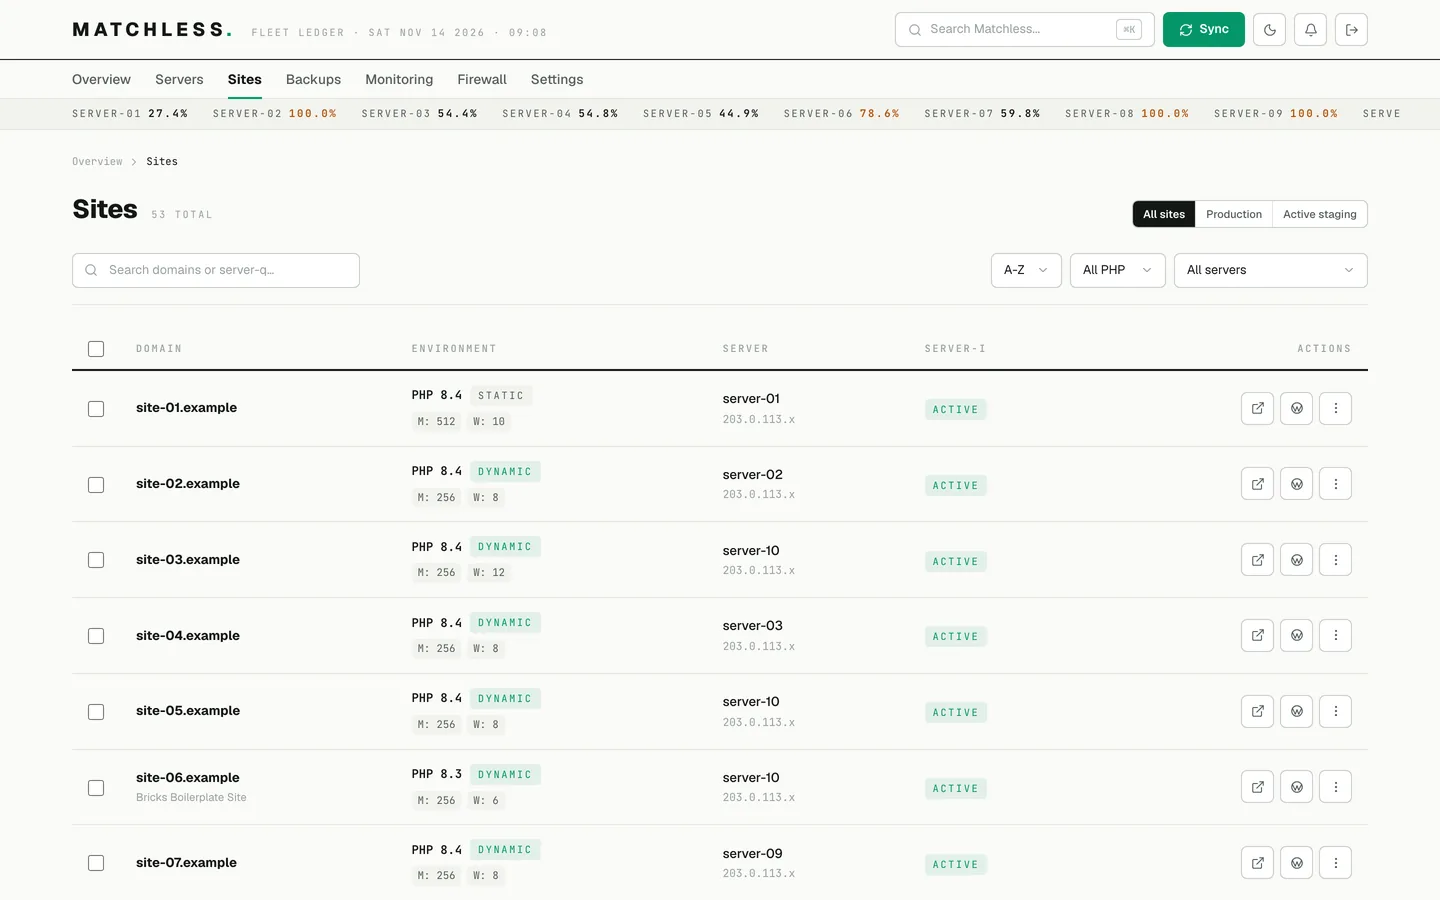
The sites list is GridPane's site list: PHP version, memory limit and PHP worker settings for each site, with links to the site and its WordPress admin. Select several sites and you can change their PHP settings together. The app sends those one site at a time, 35 seconds apart, because GridPane's API punishes anything faster (more on that below).
A site's own page is where most of the work happens:
- PHP version, PHP settings and PHP workers (seven php.ini values and five PHP-FPM values) write to GridPane. Each field saves on its own and reverts if GridPane refuses it.
- Backup cadence shows the site's schedules, read from GridPane.
- Staging is recorded by hand, because GridPane's API can't see it (below).
- 7G firewall has the exception generator.
- Cloudflare WAF shows how the site's Cloudflare zone compares to my standard rules.
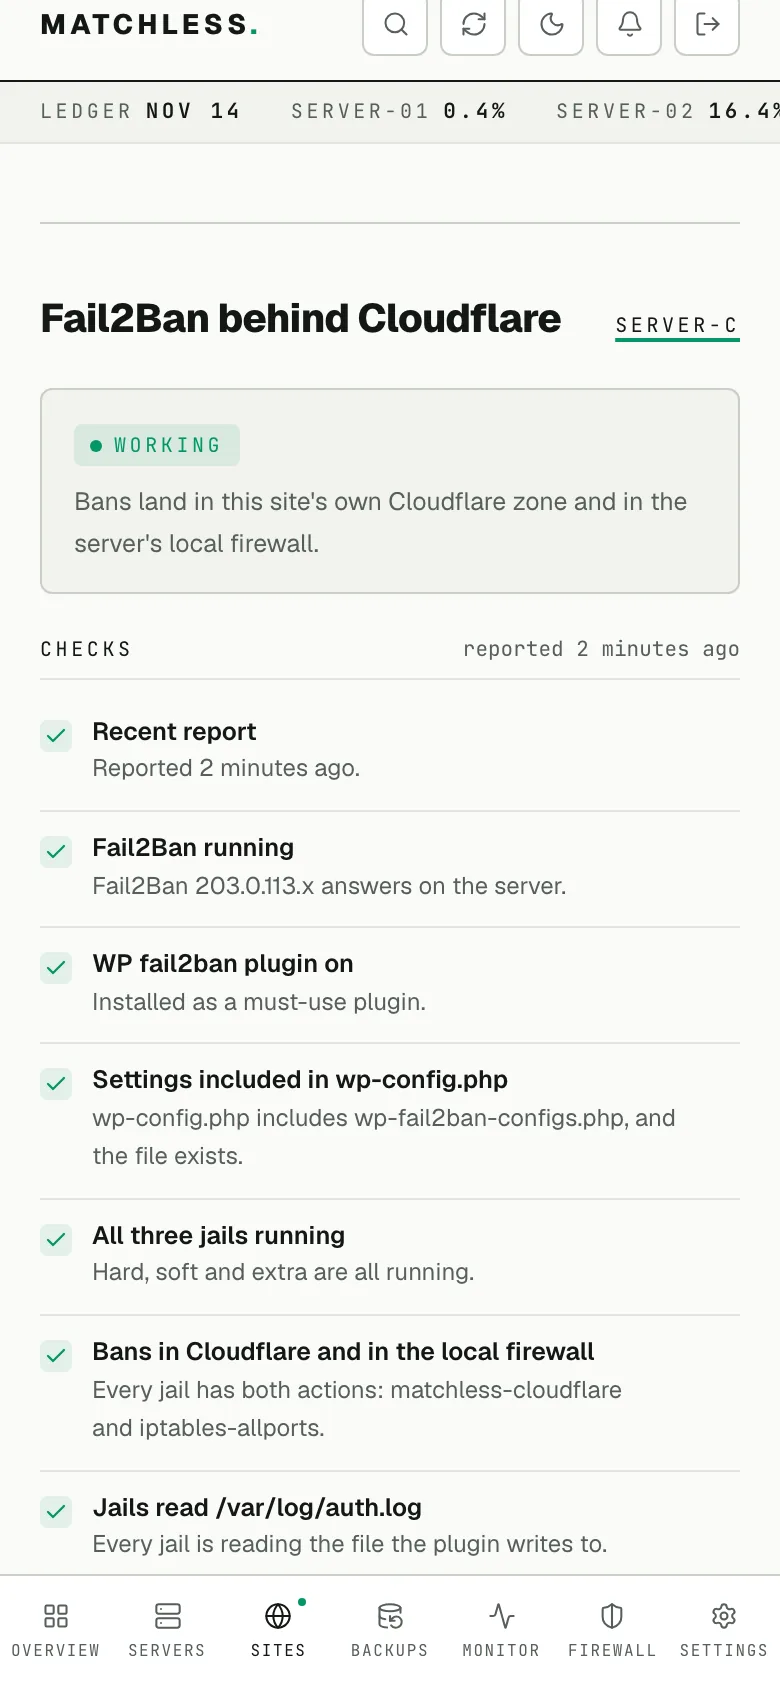
- Fail2Ban shows the site's own jails, its current bans and the recent log lines behind them.
Backups
GridPane lets each site have several backup schedules, local and remote. With more than 140 of them across 10 servers, backups on the same server started at the same minute without anyone choosing that. The backups page counts schedules per server and finds collisions: two backups on one server, of the same type and cadence, at the same time. When I first ran it, 19 schedules sat in 7 collisions.
To fix one, I pick a stagger and the app rebuilds that server's whole backup timeline with the change applied. It won't let me apply a plan that lands two backups in the same slot. Then it writes the new times to GridPane, one schedule at a time.
Monitoring
Monitoring lists every server with a "live agent" badge when its last report is less than 15 minutes old. Open a server and you see its latest top output in a terminal panel that updates as reports arrive. That's the closest the dashboard gets to a shell, and it's read-only.
Firewall
The firewall page shows two lists. "Never blocked" is the addresses I've allowed on every server, and a banner says whether the address I'm connecting from right now is covered. "Blocked" is what each server's firewall actually holds, as reported by the agent, next to what I recorded. An address can be recorded but not confirmed, confirmed on the server, or on the server with no record, and the page shows which.
The app can't add a block itself. It writes the commands, and I run them over SSH.
Settings
Settings holds the warning and critical thresholds for CPU, memory and disk that every meter uses, and two panels that say where the keys live. GridPane's token is a secret in Cloudflare Workers, so the browser never sees it. The Cloudflare token isn't in the app at all.
What GridPane's API can't do
GridPane's API covers the basics well: servers, sites, a site's full settings (over 200 fields), its domains, its backup schedules, and writes for PHP settings and backup times. What it doesn't cover shaped the app as much as what it does.
Staging sites. The API can't tell you whether a site has a live staging copy. The obvious endpoints return 404 or "That site does not belong to the bearer of this access token," and asking for staging sites returns none. The one staging field in a site's settings is the date a staging copy was first built, and it isn't cleared when the copy is deleted. An early version of the app trusted that field and showed six staging sites when GridPane had one. Now the site page has a small record I keep by hand ("Staging is live" or "No staging"), labeled as recorded here, not read from GridPane. A staging copy's page is read-only, because any save there would change the live site.
Logs. The API has a logs route, but it answers with the same "does not belong to the bearer" refusal for every log type, while the same token reads the same site's settings fine. As far as I can tell it only works with a signed-in browser session in GridPane's own dashboard. So no app can read a site's 7G log, its nginx access or error log, or its PHP log through the API. I found that out the hard way: my first version had log viewers, and they were showing sample lines, the same on every site. I deleted them.
Other gaps:
- The PHP slow log can't be switched on through the API. Every payload shape I tried came back 422, "No command was committed to the server." So Fleet shows the slow log settings read-only, as of the last sync, and says to change them in GridPane.
- There's no single sign-on to WordPress admin over the API (GridPane does it on the server), and no stable link into a site's page in GridPane's dashboard.
- Fail2Ban isn't in the API at all.
Quirks worth knowing before you write to it:
- Send a number as a number and you get a 429, "you're going too fast," instead of a validation error. Send it as a string.
- Changing one PHP worker setting on its own also 429s. Send the process manager mode (
pm) with it. - The site update is really a partial update: send only the fields you're changing.
- After a refusal there's a cooldown of about a minute, and retrying makes it longer.
- The rate limit isn't a simple window. In August the response headers said 12 calls per endpoint and 60 in total per minute. In September, runs were refused at about six a minute, shared across endpoints. So the sync starts slow, slows down a little more each time GridPane says no, and carries that pace into its next pass.
Copy and paste: the 7G exception generator
GridPane runs the 7G firewall on nginx, and it sometimes blocks requests I want, like an SEO plugin's preview or a form plugin's webhook. The fix is an exception file in a place GridPane's updates won't overwrite, and the syntax is fiddly.
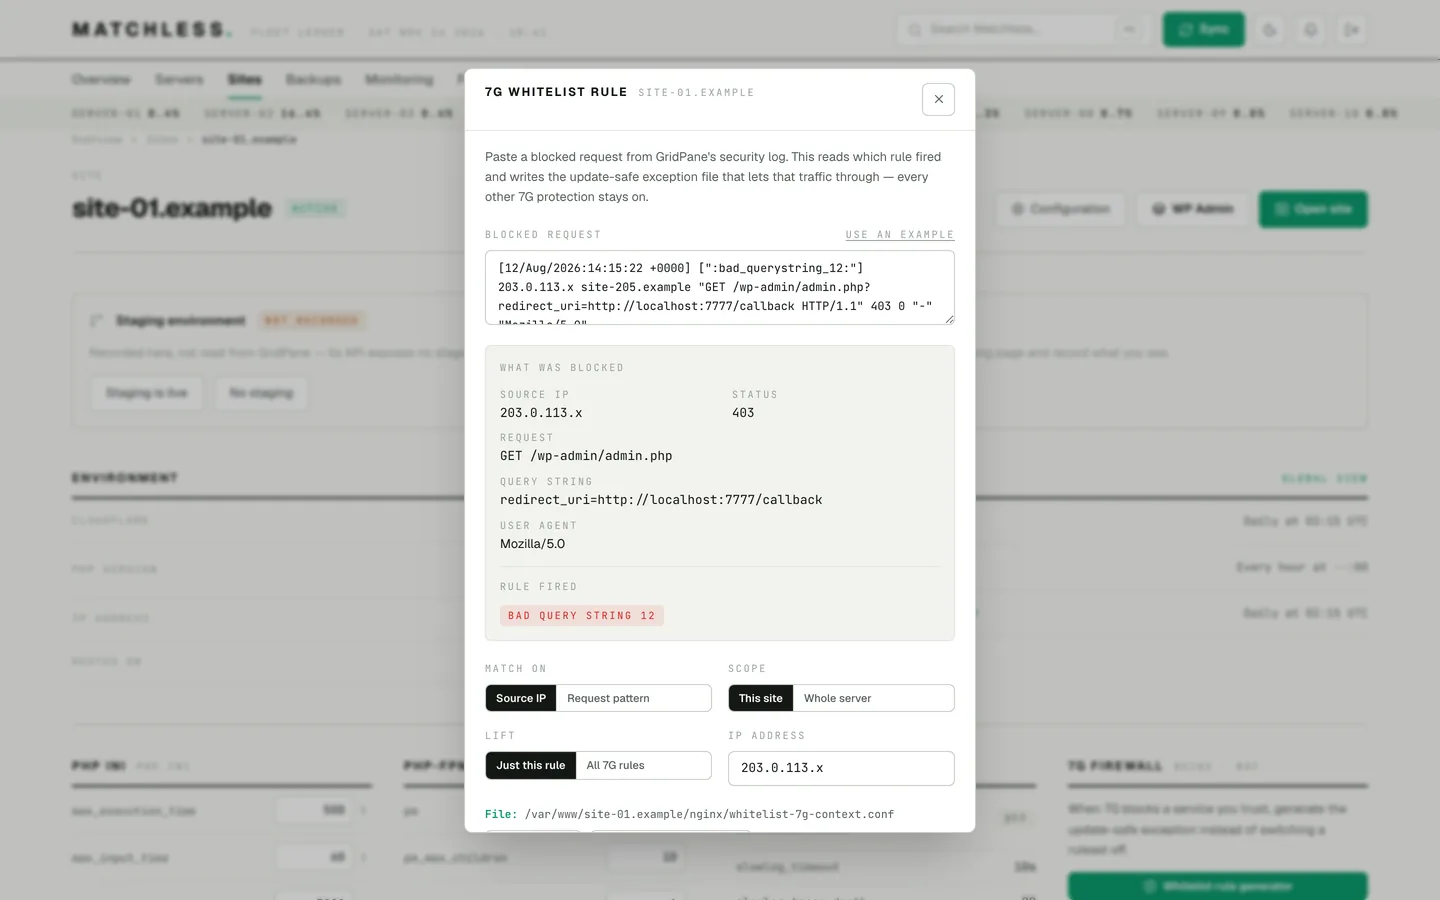
Since the app can't read the 7G log, the site page has a generator instead. Paste the blocked line from the log. It shows what was blocked and which rule fired, lets me match on the source address or a pattern, for one site or the whole server, and writes the exception: which file to add it to, and the commands to check nginx's config and reload it. Then I paste those on the server myself.
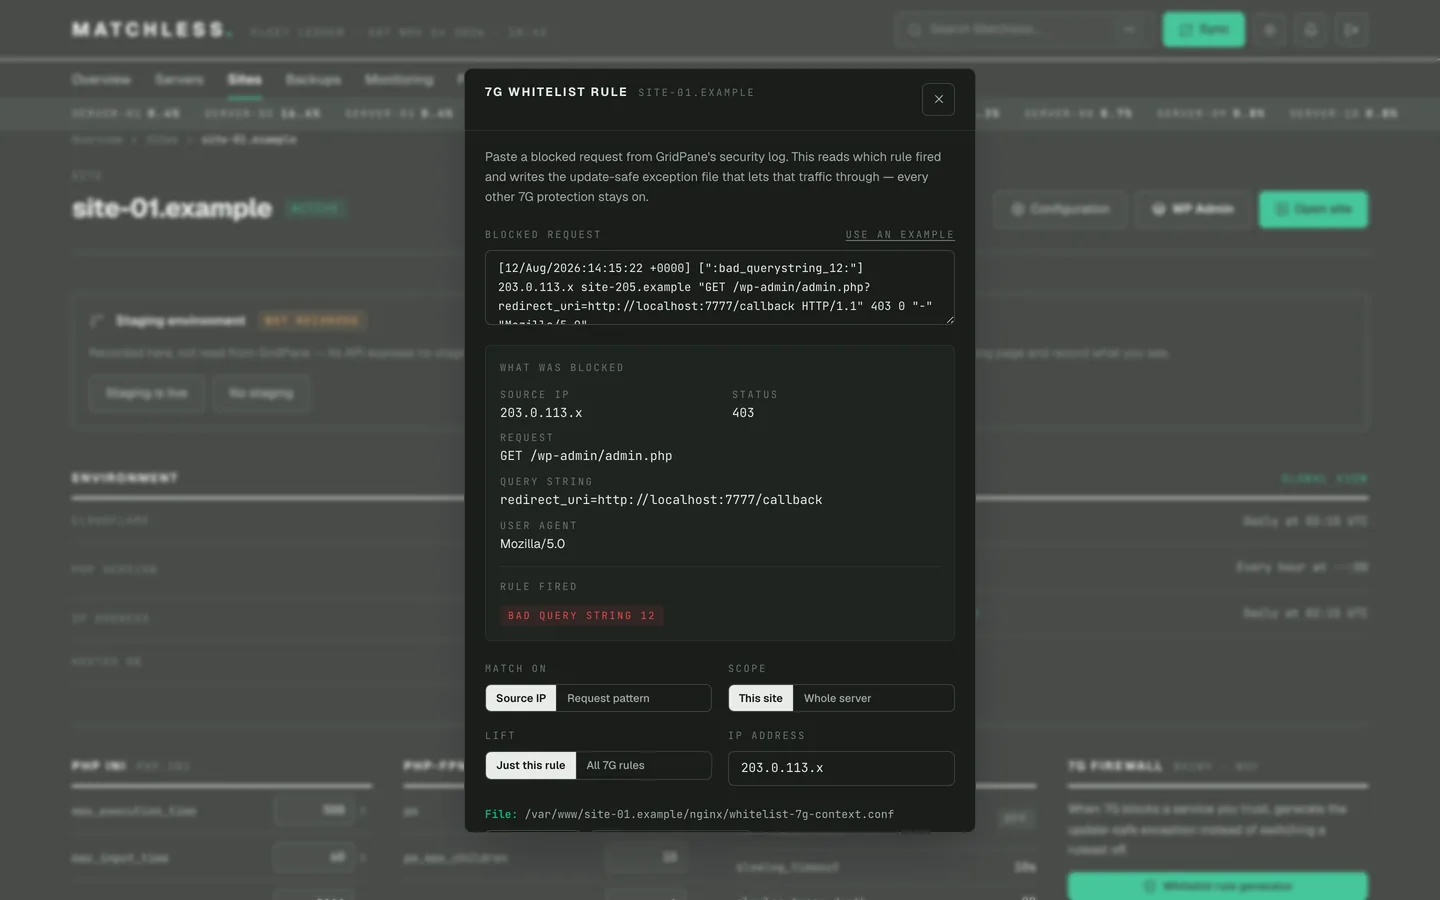
That generator was the first version of an idea I later rebuilt from scratch as 7G Helper, a free tool anyone on GridPane can use in a browser. It goes further: it matches the line against GridPane's real rule set, names the exact pattern that matched, and gives you a test that must pass and one that must still be blocked. I wrote about it in 7G Helper: a free 7G firewall exception generator.
There's a second generator on each server's page. GridPane rotates some of its logs but not 7G's, so the 7G log grows forever (one of mine had reached 107 MB). The app writes a log rotation rule for it, and I paste that on the server too.
Fail2Ban behind Cloudflare
Fail2Ban bans an address that keeps failing to log in. Behind Cloudflare, though, every visitor reaches the server from a Cloudflare address, so a ban in the server's own firewall never matches the attacker. GridPane's documented fix uses Cloudflare's account-wide Global API Key, saved on the server.
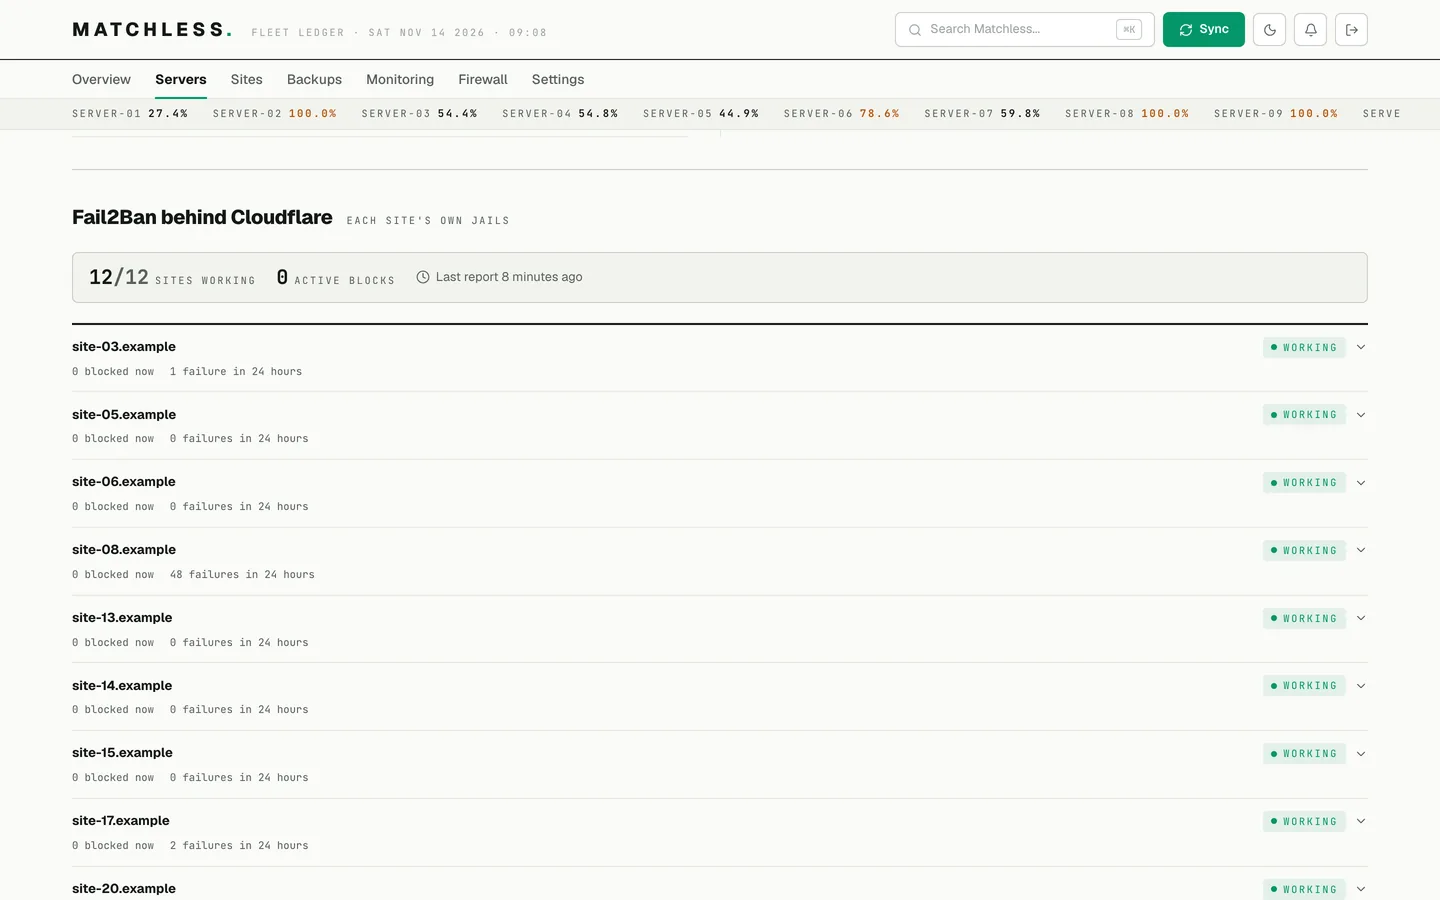
I wanted something narrower. Each site now has three jails of its own, with the same thresholds as GridPane's, and a ban goes to two places: that site's own Cloudflare zone, at the edge, and the server's firewall. Each server holds one Cloudflare token that can only manage firewall access rules on that server's zones, and only from that server's address. A ban on one client's site never touches another client's zone. I set it up by script over SSH: a dry run first, then a live run that proves a ban and an unban end to end and undoes itself if anything fails.
All of it shows in the app. A server's page lists every site's Fail2Ban status, sites with active bans first. A site's page shows each check, the three jails, current bans with their expiry, and the recent log lines behind them. Each site is Working, Plugin off, Local firewall only, Broken (with the first check that failed), or Not reported. The agent sends the facts every 10 minutes and the app works out the status from the same checks my audit script makes, so the two agree by design. When it went out to all 10 servers, a fresh audit matched the app on all 56 sites.
Cloudflare WAF, zone by zone
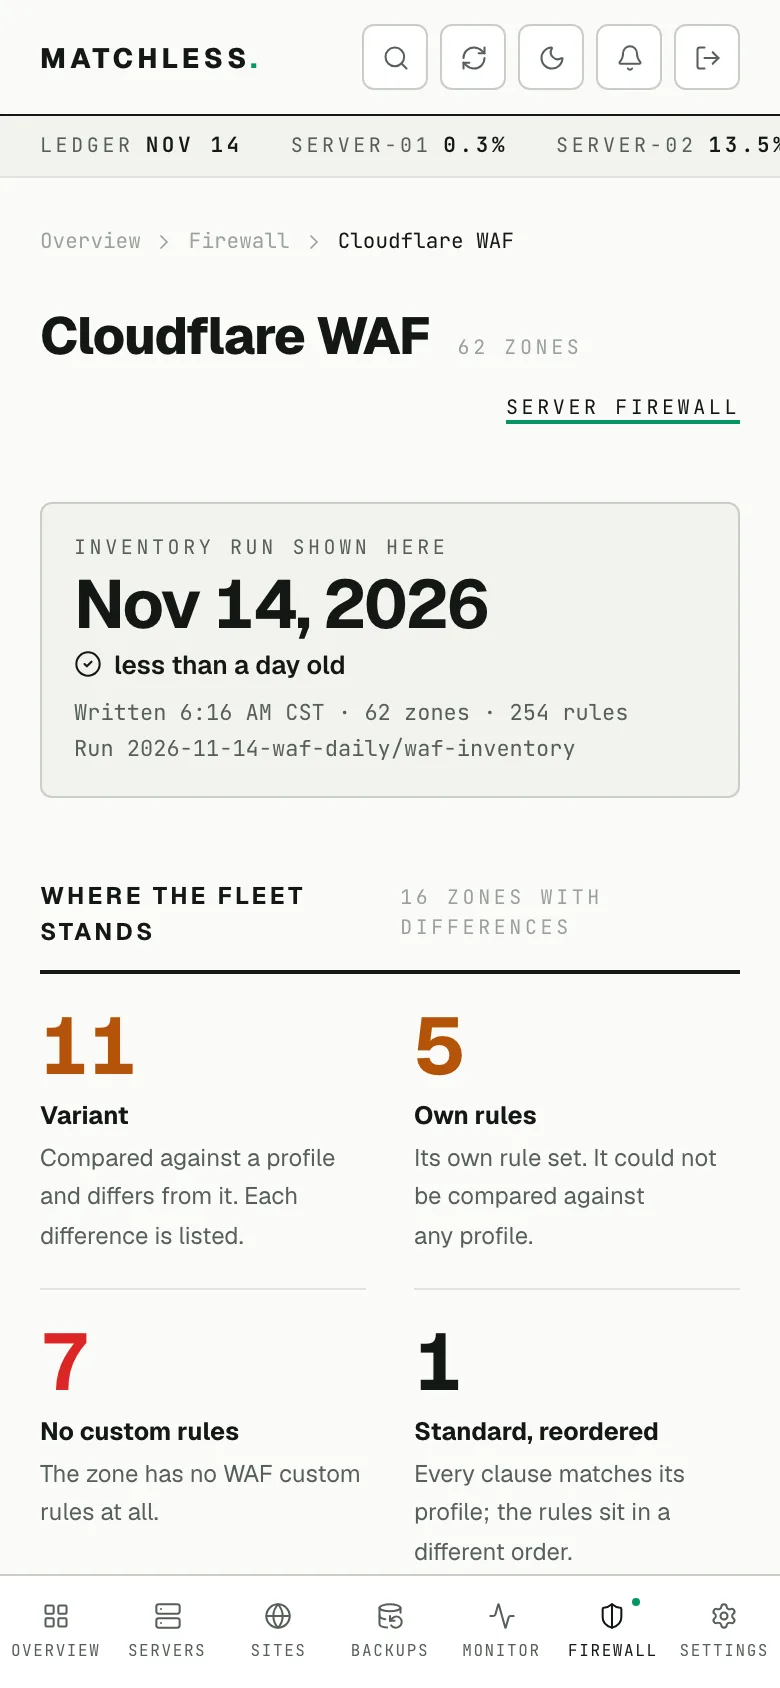
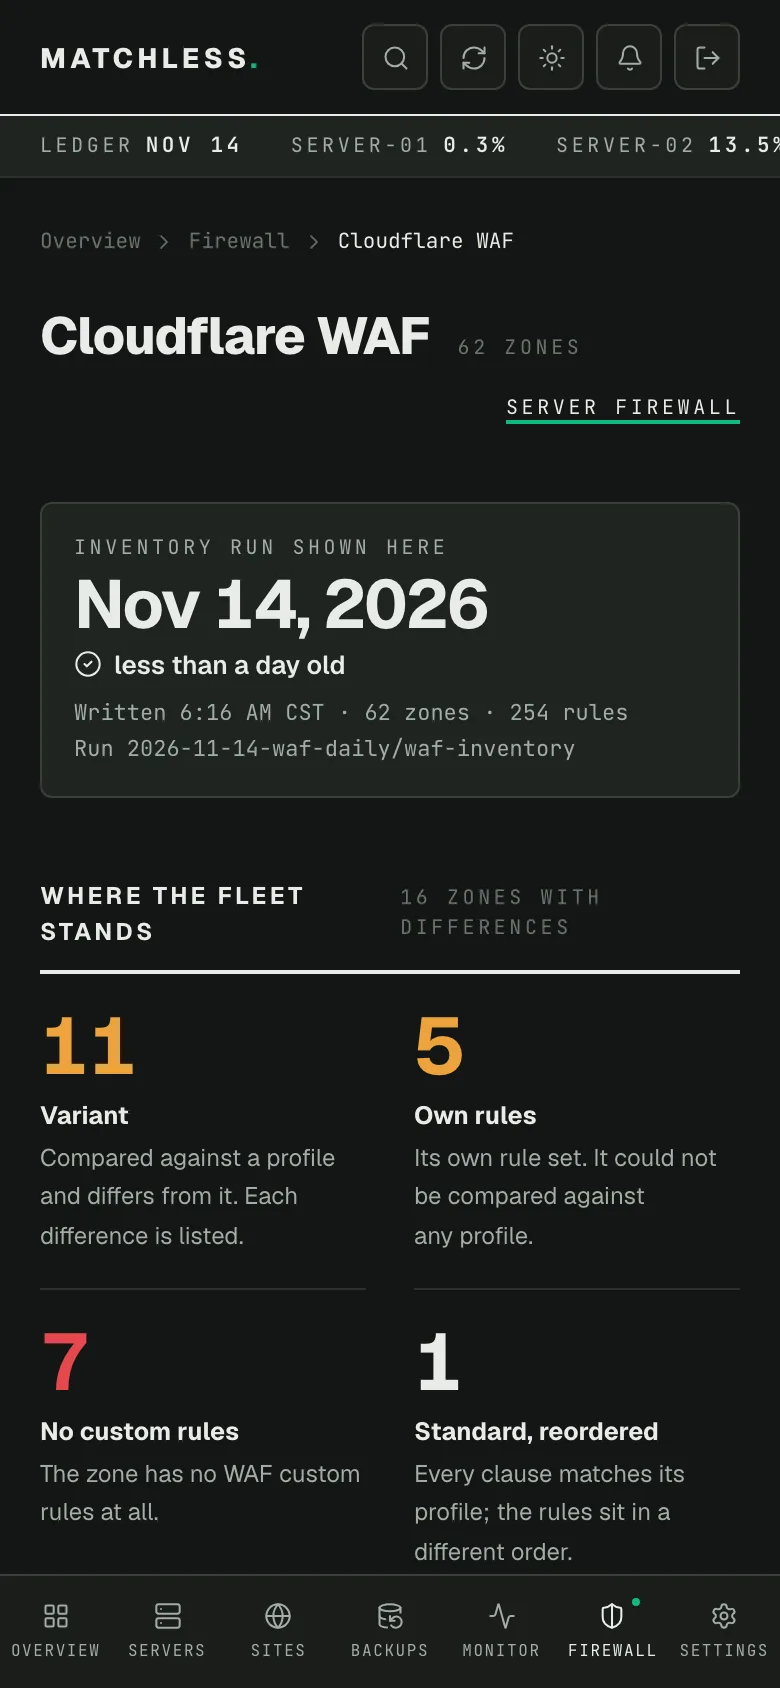
I keep a five-rule standard for Cloudflare's firewall on WordPress sites, with lighter versions for static and development sites. The WAF pages show how all 62 zones I manage compare to it. Each zone gets a grade:
- Standard: matches its profile rule for rule, in order.
- Standard, reordered: the same rules in a different order.
- Variant: different, with every difference listed.
- Own rules: too different to compare.
- No custom rules: nothing at all.
A zone's page also says whether the firewall actually stands in front of the site. If the site's DNS record skips Cloudflare's proxy, visitors skip the rules, and the page marks it "Bypassed."
The app never calls Cloudflare. A token that can read every account I manage stays on my Mac, and the daily job loads its report into the database. It masks anything in a rule that looks like a secret and refuses to load a report where one survived. The cost is honest and printed on the settings page: while my Mac is off, nothing refreshes, and the date on every WAF view gets older.
Keeping it locked down
Fleet sits behind Cloudflare Access, then its own sign-in: a passkey, or a password plus a code from an authenticator app. Every table in the database needs a signed-in user. Each server's agent has its own token, and the database stores only a hash of it.
The design does most of the work, though. The agent only sends, so there's no path from the dashboard to running anything on a server. The only things the dashboard can change are PHP settings and backup times. Everything else is a page to read or a command for me to paste.
On a phone
I use Fleet mostly from my phone, saved to the home screen as an app. Under tablet width the menu becomes a seven-tab bar along the bottom, tables become stacked rows, every tap target is at least 44 pixels, and links are real links, because pop-ups don't open from a home-screen app.
What I'd tell another developer
- Prove an API limit with a control request before you believe it. The logs refusal looked like a permissions problem until the same token read the same site's settings in the next call.
- Never show sample data as if it were live. In an operations dashboard, that's the worst bug there is. My fake log viewers looked useful right up until I noticed they showed the same lines for every site.
- Let the API's refusals set your pace. I guessed GridPane's rate limit twice and got it wrong both times.
- Write first, then prune. A sync that deletes and then reinserts can die in between and leave a site with no backup schedules. Mine did, once.
- Say where the data came from. Every panel that isn't live from an API says so, and that's made me trust the ones that are.
Stack: Next.js 16, React 19, Tailwind 4, Supabase (Postgres, Auth, Realtime) on Cloudflare Workers, a bash agent on each server, and a Python job on my Mac for Cloudflare. Fleet stays private. If you'd like to see a part of it in more detail, tell me.

Jon Phillips builds websites, web apps and automations at Matchless Web in Clinton, Mississippi.